
|
Indian Overseas Bank (IOB.NS) DCF -Bewertung |
Fully Editable: Tailor To Your Needs In Excel Or Sheets
Professional Design: Trusted, Industry-Standard Templates
Investor-Approved Valuation Models
MAC/PC Compatible, Fully Unlocked
No Expertise Is Needed; Easy To Follow
Indian Overseas Bank (IOB.NS) Bundle
Verbessern Sie Ihre Anlagestrategien mit dem DCF -Taschenrechner (IOBNS)! Verwenden Sie authentische Finanzdaten der indischen Übersee-Bank, ändern Sie Wachstumsprojektionen und -kosten und beobachten Sie, wie sich diese Anpassungen in Echtzeit auf den inneren Wert von (IOBNS) auswirken.
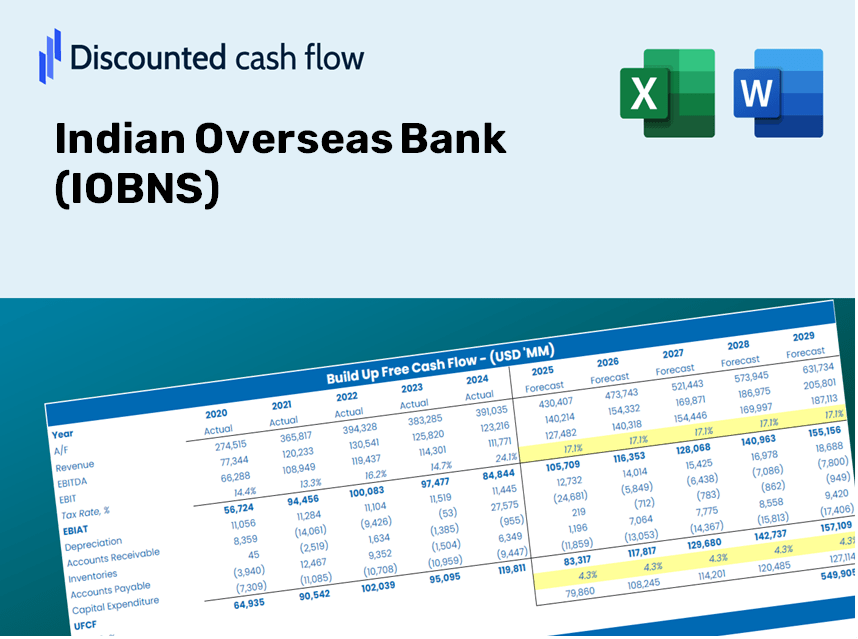
Discounted Cash Flow (DCF) - (USD MM)
| Year | AY1 2021 |
AY2 2022 |
AY3 2023 |
AY4 2024 |
AY5 2025 |
FY1 2026 |
FY2 2027 |
FY3 2028 |
FY4 2029 |
FY5 2030 |
|---|---|---|---|---|---|---|---|---|---|---|
| Revenue | 224,597.1 | 72,377.7 | 87,832.6 | 121,531.1 | 337,485.1 | 415,060.7 | 510,468.1 | 627,806.2 | 772,116.0 | 949,597.4 |
| Revenue Growth, % | 0 | -67.77 | 21.35 | 38.37 | 177.69 | 22.99 | 22.99 | 22.99 | 22.99 | 22.99 |
| EBITDA | 6,697.8 | 18,818.3 | 23,644.1 | .0 | 37,899.6 | 55,727.6 | 68,537.3 | 84,291.5 | 103,667.1 | 127,496.4 |
| EBITDA, % | 2.98 | 26 | 26.92 | 0 | 11.23 | 13.43 | 13.43 | 13.43 | 13.43 | 13.43 |
| Depreciation | .0 | 1,725.6 | 2,604.2 | 3,363.7 | 3,944.6 | 7,708.2 | 9,480.1 | 11,659.2 | 14,339.2 | 17,635.3 |
| Depreciation, % | 0 | 2.38 | 2.96 | 2.77 | 1.17 | 1.86 | 1.86 | 1.86 | 1.86 | 1.86 |
| EBIT | 6,697.8 | 17,092.7 | 21,039.9 | -3,363.7 | 33,955.0 | 48,019.3 | 59,057.2 | 72,632.3 | 89,327.9 | 109,861.1 |
| EBIT, % | 2.98 | 23.62 | 23.95 | -2.77 | 10.06 | 11.57 | 11.57 | 11.57 | 11.57 | 11.57 |
| Total Cash | 307,763.4 | 369,512.6 | 208,205.7 | 188,149.0 | 212,196.4 | 384,243.1 | 472,566.6 | 581,192.5 | 714,787.6 | 879,091.3 |
| Total Cash, percent | .0 | .0 | .0 | .0 | .0 | .0 | .0 | .0 | .0 | .0 |
| Account Receivables | 51,065.3 | 59,985.4 | 81,903.6 | 124,924.1 | 160,185.3 | 287,494.9 | 353,579.5 | 434,854.6 | 534,811.9 | 657,745.7 |
| Account Receivables, % | 22.74 | 82.88 | 93.25 | 102.79 | 47.46 | 69.27 | 69.27 | 69.27 | 69.27 | 69.27 |
| Inventories | .0 | -458,645.1 | -326,316.6 | -313,073.1 | .0 | -249,036.4 | -306,280.8 | -376,683.7 | -463,269.6 | -569,758.4 |
| Inventories, % | 0 | -633.68 | -371.52 | -257.61 | 0 | -60 | -60 | -60 | -60 | -60 |
| Accounts Payable | 402.2 | 414.4 | 2,799.2 | 4,025.0 | 2,676.5 | 6,677.2 | 8,212.0 | 10,099.7 | 12,421.2 | 15,276.4 |
| Accounts Payable, % | 0.17909 | 0.57252 | 3.19 | 3.31 | 0.79307 | 1.61 | 1.61 | 1.61 | 1.61 | 1.61 |
| Capital Expenditure | -666.6 | -562.3 | -5,823.6 | -3,652.6 | -6,032.8 | -10,374.1 | -12,758.8 | -15,691.6 | -19,298.5 | -23,734.5 |
| Capital Expenditure, % | -0.29678 | -0.77693 | -6.63 | -3.01 | -1.79 | -2.5 | -2.5 | -2.5 | -2.5 | -2.5 |
| Tax Rate, % | 25.74 | 25.74 | 25.74 | 25.74 | 25.74 | 25.74 | 25.74 | 25.74 | 25.74 | 25.74 |
| EBITAT | 6,048.8 | 16,424.7 | 18,810.7 | -2,619.8 | 25,214.7 | 41,099.8 | 50,547.1 | 62,166.1 | 76,455.8 | 94,030.2 |
| Depreciation | ||||||||||
| Changes in Account Receivables | ||||||||||
| Changes in Inventories | ||||||||||
| Changes in Accounts Payable | ||||||||||
| Capital Expenditure | ||||||||||
| UFCF | -45,280.8 | 467,325.2 | -136,270.7 | -57,946.9 | -326,556.4 | 164,161.4 | 39,963.1 | 49,149.1 | 60,446.7 | 74,341.3 |
| WACC, % | 16.39 | 17.23 | 16.25 | 14.57 | 14.05 | 15.7 | 15.7 | 15.7 | 15.7 | 15.7 |
| PV UFCF | ||||||||||
| SUM PV UFCF | 273,072.4 | |||||||||
| Long Term Growth Rate, % | 2.00 | |||||||||
| Free cash flow (T + 1) | 75,828 | |||||||||
| Terminal Value | 553,585 | |||||||||
| Present Terminal Value | 267,031 | |||||||||
| Enterprise Value | 540,104 | |||||||||
| Net Debt | 210,080 | |||||||||
| Equity Value | 330,023 | |||||||||
| Diluted Shares Outstanding, MM | 18,969 | |||||||||
| Equity Value Per Share | 17.40 |
Benefits You Will Receive
- Adjustable Forecast Inputs: Effortlessly modify key assumptions (growth %, margins, WACC) to explore various scenarios.
- Comprehensive Financial Data: Indian Overseas Bank’s (IOBNS) financial figures pre-loaded to facilitate your analysis.
- Automated DCF Calculations: The template computes Net Present Value (NPV) and intrinsic value automatically for your convenience.
- Professional and Adaptable: A refined Excel model tailored to meet your valuation requirements.
- Designed for Analysts and Investors: Perfect for testing forecasts, assessing strategies, and optimizing your time.
Key Features
- 🔍 Real-Life IOBNS Financials: Pre-filled historical and projected data for Indian Overseas Bank.
- ✏️ Fully Customizable Inputs: Modify all essential parameters (yellow cells) such as WACC, growth %, and tax rates.
- 📊 Professional DCF Valuation: Integrated formulas calculate the intrinsic value of Indian Overseas Bank using the Discounted Cash Flow method.
- ⚡ Instant Results: View Indian Overseas Bank’s valuation immediately after adjustments.
- Scenario Analysis: Test and compare different outcomes based on various financial assumptions side-by-side.
How It Works
- Step 1: Download the prebuilt Excel template featuring Indian Overseas Bank’s (IOBNS) data.
- Step 2: Navigate through the pre-filled sheets to familiarize yourself with the essential metrics.
- Step 3: Modify forecasts and assumptions in the editable yellow cells (WACC, growth, margins).
- Step 4: Instantly view updated results, including Indian Overseas Bank’s (IOBNS) intrinsic value.
- Step 5: Make well-informed investment choices or create reports based on the generated outputs.
Why Opt for This Calculator?
- Designed for Experts: A sophisticated tool utilized by financial analysts, CFOs, and consultants.
- Accurate Historical Data: Indian Overseas Bank’s (IOBNS) historical and projected financials preloaded for precise analysis.
- Forecast Simulation: Easily test various scenarios and assumptions.
- Insightful Outputs: Automatically computes intrinsic value, NPV, and essential financial metrics.
- User-Friendly: Comprehensive step-by-step guidance throughout the process.
Who Can Benefit from This Product?
- Finance Students: Master valuation methods and practice using real-world data.
- Researchers: Integrate advanced financial models into academic studies or projects.
- Investors: Evaluate your investment hypotheses and assess valuation results for Indian Overseas Bank (IOBNS).
- Financial Analysts: Enhance your efficiency with a customizable, ready-to-use DCF model.
- Entrepreneurs: Discover the analytical approaches used for evaluating major public institutions like Indian Overseas Bank (IOBNS).
What the Template Contains
- Historical Data: Contains Indian Overseas Bank’s past financial performance and baseline forecasts.
- DCF and Levered DCF Models: Comprehensive templates for calculating the intrinsic value of Indian Overseas Bank (IOBNS).
- WACC Sheet: Built-in calculations for the Weighted Average Cost of Capital.
- Editable Inputs: Adjust essential parameters such as growth rates, EBITDA percentages, and CAPEX estimates.
- Quarterly and Annual Statements: A thorough analysis of Indian Overseas Bank’s financial statements.
- Interactive Dashboard: Dynamically visualize valuation results and projections.
Disclaimer
All information, articles, and product details provided on this website are for general informational and educational purposes only. We do not claim any ownership over, nor do we intend to infringe upon, any trademarks, copyrights, logos, brand names, or other intellectual property mentioned or depicted on this site. Such intellectual property remains the property of its respective owners, and any references here are made solely for identification or informational purposes, without implying any affiliation, endorsement, or partnership.
We make no representations or warranties, express or implied, regarding the accuracy, completeness, or suitability of any content or products presented. Nothing on this website should be construed as legal, tax, investment, financial, medical, or other professional advice. In addition, no part of this site—including articles or product references—constitutes a solicitation, recommendation, endorsement, advertisement, or offer to buy or sell any securities, franchises, or other financial instruments, particularly in jurisdictions where such activity would be unlawful.
All content is of a general nature and may not address the specific circumstances of any individual or entity. It is not a substitute for professional advice or services. Any actions you take based on the information provided here are strictly at your own risk. You accept full responsibility for any decisions or outcomes arising from your use of this website and agree to release us from any liability in connection with your use of, or reliance upon, the content or products found herein.