
|
IO Biotech, Inc. (IOBT) DCF -Bewertung |
Fully Editable: Tailor To Your Needs In Excel Or Sheets
Professional Design: Trusted, Industry-Standard Templates
Investor-Approved Valuation Models
MAC/PC Compatible, Fully Unlocked
No Expertise Is Needed; Easy To Follow
IO Biotech, Inc. (IOBT) Bundle
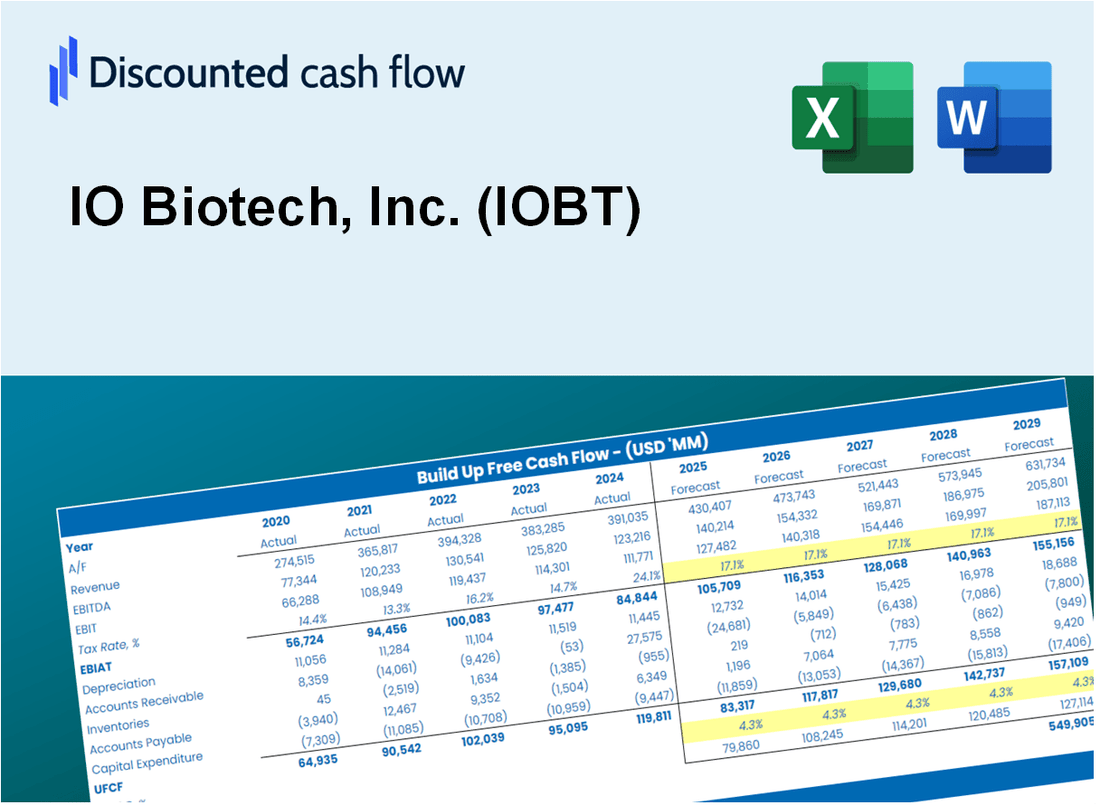
Bewerten Sie die finanzielle Aussichten von IO Biotech, Inc. (IOBT) mit Experten -Präzision! Dieser (IOBT) DCF-Taschenrechner verfügt über vorgefüllte Finanzdaten und ermöglicht es Ihnen, das Umsatzwachstum, die WACC, die Margen und andere kritische Annahmen leicht zu ändern, um sich an Ihren Projektionen auszurichten.
Discounted Cash Flow (DCF) - (USD MM)
| Year | AY1 2020 |
AY2 2021 |
AY3 2022 |
AY4 2023 |
AY5 2024 |
FY1 2025 |
FY2 2026 |
FY3 2027 |
FY4 2028 |
FY5 2029 |
|---|---|---|---|---|---|---|---|---|---|---|
| Revenue | .0 | .0 | .0 | .0 | .0 | .0 | .0 | .0 | .0 | .0 |
| Revenue Growth, % | 0 | 0 | 0 | 0 | 0 | 0 | 0 | 0 | 0 | 0 |
| EBITDA | .0 | -67.5 | -69.3 | -91.2 | -93.2 | .0 | .0 | .0 | .0 | .0 |
| EBITDA, % | 100 | 100 | 100 | 100 | 100 | 100 | 100 | 100 | 100 | 100 |
| Depreciation | 10.1 | .0 | .5 | .2 | .8 | .0 | .0 | .0 | .0 | .0 |
| Depreciation, % | 100 | 100 | 100 | 100 | 100 | 100 | 100 | 100 | 100 | 100 |
| EBIT | -10.1 | -67.5 | -69.9 | -91.4 | -94.0 | .0 | .0 | .0 | .0 | .0 |
| EBIT, % | 100 | 100 | 100 | 100 | 100 | 100 | 100 | 100 | 100 | 100 |
| Total Cash | 3.4 | 211.5 | 142.6 | 143.2 | 60.0 | .0 | .0 | .0 | .0 | .0 |
| Total Cash, percent | .0 | .0 | .0 | .0 | .0 | .0 | .0 | .0 | .0 | .0 |
| Account Receivables | 1.5 | 2.1 | 1.5 | 1.1 | 1.1 | .0 | .0 | .0 | .0 | .0 |
| Account Receivables, % | 100 | 100 | 100 | 100 | 100 | 100 | 100 | 100 | 100 | 100 |
| Inventories | .4 | -2.1 | -1.5 | .0 | .0 | .0 | .0 | .0 | .0 | .0 |
| Inventories, % | 100 | 100 | 100 | 100 | 100 | 100 | 100 | 100 | 100 | 100 |
| Accounts Payable | .5 | 3.9 | 4.0 | 3.9 | 4.7 | .0 | .0 | .0 | .0 | .0 |
| Accounts Payable, % | 100 | 100 | 100 | 100 | 100 | 100 | 100 | 100 | 100 | 100 |
| Capital Expenditure | .0 | -.2 | -.7 | -.3 | .0 | .0 | .0 | .0 | .0 | .0 |
| Capital Expenditure, % | 100 | 100 | 100 | 100 | 100 | 0 | 0 | 0 | 0 | 0 |
| Tax Rate, % | -1.53 | -1.53 | -1.53 | -1.53 | -1.53 | -1.53 | -1.53 | -1.53 | -1.53 | -1.53 |
| EBITAT | -10.2 | -67.5 | -71.2 | -92.4 | -95.5 | .0 | .0 | .0 | .0 | .0 |
| Depreciation | ||||||||||
| Changes in Account Receivables | ||||||||||
| Changes in Inventories | ||||||||||
| Changes in Accounts Payable | ||||||||||
| Capital Expenditure | ||||||||||
| UFCF | -1.4 | -62.4 | -71.2 | -93.7 | -93.9 | -3.5 | .0 | .0 | .0 | .0 |
| WACC, % | 4.69 | 4.69 | 4.69 | 4.69 | 4.69 | 4.69 | 4.69 | 4.69 | 4.69 | 4.69 |
| PV UFCF | ||||||||||
| SUM PV UFCF | -3.4 | |||||||||
| Long Term Growth Rate, % | 2.00 | |||||||||
| Free cash flow (T + 1) | 0 | |||||||||
| Terminal Value | 0 | |||||||||
| Present Terminal Value | 0 | |||||||||
| Enterprise Value | -3 | |||||||||
| Net Debt | -58 | |||||||||
| Equity Value | 55 | |||||||||
| Diluted Shares Outstanding, MM | 66 | |||||||||
| Equity Value Per Share | 0.83 |
What You Will Receive
- Accurate IOBT Financial Data: Pre-filled with IO Biotech’s historical and projected data for detailed analysis.
- Completely Customizable Template: Easily adjust key inputs such as revenue growth, WACC, and EBITDA %.
- Instant Calculations: Watch IOBT’s intrinsic value update in real-time as you make adjustments.
- Expert Valuation Tool: Tailored for investors, analysts, and consultants aiming for precise DCF outcomes.
- Intuitive Design: Streamlined layout and straightforward instructions suitable for all skill levels.
Key Features
- Comprehensive Data: IO Biotech’s historical financial reports and projected forecasts.
- Customizable Inputs: Adjust WACC, tax rates, revenue growth, and EBITDA margins to suit your analysis.
- Real-Time Results: Instantly view IO Biotech’s intrinsic value as you modify inputs.
- Intuitive Visual Outputs: Dashboard graphs illustrate valuation results and essential metrics.
- Precision Engineered: A reliable tool designed for analysts, investors, and finance professionals.
How It Works
- Step 1: Download the prebuilt Excel template with IO Biotech’s (IOBT) data included.
- Step 2: Explore the pre-filled sheets and familiarize yourself with the key metrics.
- Step 3: Update forecasts and assumptions in the editable yellow cells (WACC, growth, margins).
- Step 4: Instantly view recalculated results, including IO Biotech’s (IOBT) intrinsic value.
- Step 5: Make informed investment decisions or create reports using the outputs.
Why Choose IO Biotech, Inc. (IOBT) Calculator?
- All-in-One Solution: Combines DCF, WACC, and financial ratio analyses tailored for biotech.
- Flexible Inputs: Modify highlighted cells to explore different investment scenarios.
- In-Depth Analysis: Automatically computes IO Biotech’s intrinsic value and Net Present Value.
- Integrated Data: Historical and projected data provide a strong foundation for analysis.
- Expert-Level Tool: Perfect for financial analysts, biotech investors, and business advisors.
Who Should Use This Product?
- Individual Investors: Make informed decisions about buying or selling IO Biotech, Inc. (IOBT) stock.
- Financial Analysts: Enhance valuation processes with comprehensive financial models specific to IO Biotech, Inc. (IOBT).
- Consultants: Provide clients with expert valuation insights related to IO Biotech, Inc. (IOBT) efficiently and accurately.
- Business Owners: Gain insights into how biotech companies like IO Biotech, Inc. (IOBT) are valued to inform your own business strategies.
- Finance Students: Master valuation techniques using real-world data and case studies from IO Biotech, Inc. (IOBT).
What the Template Contains
- Historical Data: Includes IO Biotech's past financials and baseline forecasts.
- DCF and Levered DCF Models: Detailed templates to calculate IO Biotech's intrinsic value.
- WACC Sheet: Pre-built calculations for Weighted Average Cost of Capital.
- Editable Inputs: Modify key drivers like growth rates, EBITDA %, and CAPEX assumptions.
- Quarterly and Annual Statements: A complete breakdown of IO Biotech's financials.
- Interactive Dashboard: Visualize valuation results and projections dynamically.
Disclaimer
All information, articles, and product details provided on this website are for general informational and educational purposes only. We do not claim any ownership over, nor do we intend to infringe upon, any trademarks, copyrights, logos, brand names, or other intellectual property mentioned or depicted on this site. Such intellectual property remains the property of its respective owners, and any references here are made solely for identification or informational purposes, without implying any affiliation, endorsement, or partnership.
We make no representations or warranties, express or implied, regarding the accuracy, completeness, or suitability of any content or products presented. Nothing on this website should be construed as legal, tax, investment, financial, medical, or other professional advice. In addition, no part of this site—including articles or product references—constitutes a solicitation, recommendation, endorsement, advertisement, or offer to buy or sell any securities, franchises, or other financial instruments, particularly in jurisdictions where such activity would be unlawful.
All content is of a general nature and may not address the specific circumstances of any individual or entity. It is not a substitute for professional advice or services. Any actions you take based on the information provided here are strictly at your own risk. You accept full responsibility for any decisions or outcomes arising from your use of this website and agree to release us from any liability in connection with your use of, or reliance upon, the content or products found herein.