
|
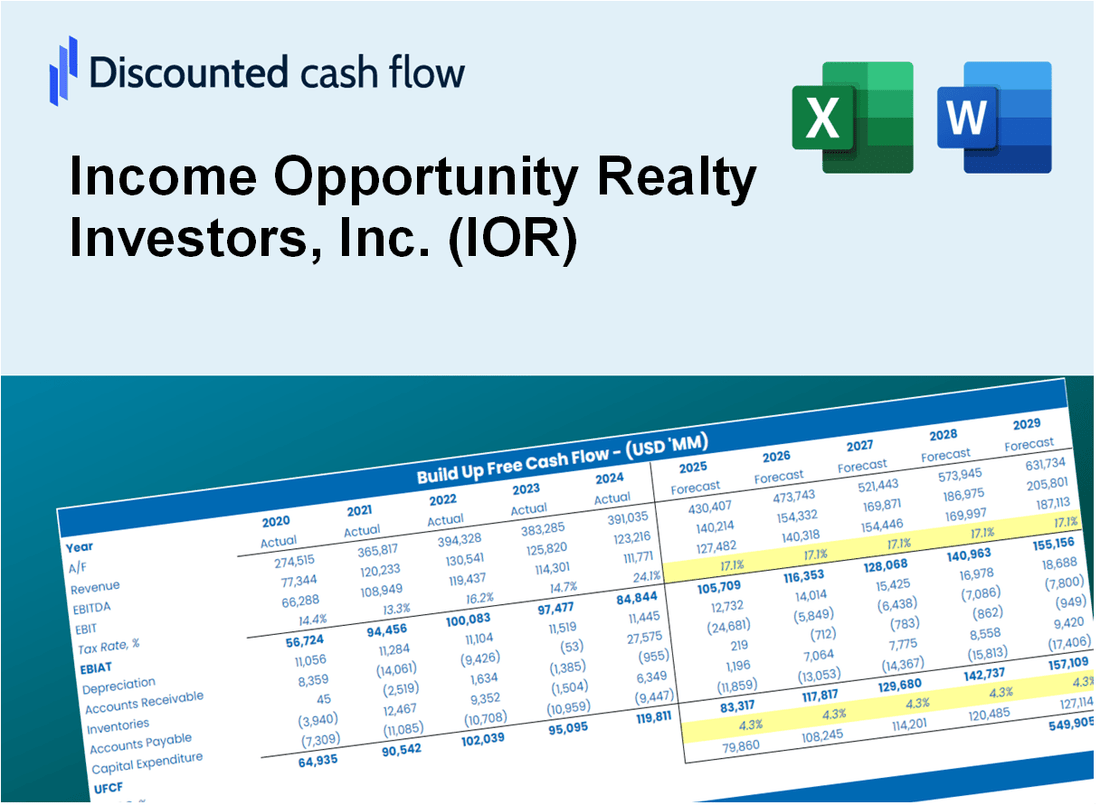
Einkommen Opportunity Realty Investors, Inc. (IOR) DCF -Bewertung |
Fully Editable: Tailor To Your Needs In Excel Or Sheets
Professional Design: Trusted, Industry-Standard Templates
Investor-Approved Valuation Models
MAC/PC Compatible, Fully Unlocked
No Expertise Is Needed; Easy To Follow
Income Opportunity Realty Investors, Inc. (IOR) Bundle
Bewerten Sie die Einkommensmöglichkeiten im Realty Investors, Inc. (IOR) finanzielle Aussichten wie ein Experte! Dieser (IOR) DCF-Taschenrechner bietet vorgefüllte Finanzdaten sowie die vollständige Flexibilität, um das Umsatzwachstum, WACC, Margen und andere wichtige Annahmen zu ändern, um sich mit Ihren Vorhersagen auszurichten.
What You Will Get
- Adjustable Investment Parameters: Modify key assumptions (rental growth %, operating expenses, capitalization rates) to explore various investment scenarios.
- Industry-Specific Data: Income Opportunity Realty Investors, Inc. (IOR) financial metrics pre-loaded to facilitate your evaluation.
- Instant DCF Calculations: The model automatically computes Net Present Value (NPV) and intrinsic value for your convenience.
- Tailored and Professional Design: A sleek Excel template that aligns with your investment analysis requirements.
- Designed for Real Estate Analysts and Investors: Perfect for assessing projections, confirming strategies, and enhancing efficiency.
Key Features
- 🔍 Real-Life IOR Financials: Pre-filled historical and projected data for Income Opportunity Realty Investors, Inc. (IOR).
- ✏️ Fully Customizable Inputs: Adjust all critical parameters (yellow cells) like WACC, growth %, and tax rates.
- 📊 Professional DCF Valuation: Built-in formulas calculate IOR’s intrinsic value using the Discounted Cash Flow method.
- ⚡ Instant Results: Visualize IOR’s valuation instantly after making changes.
- Scenario Analysis: Test and compare outcomes for various financial assumptions side-by-side.
How It Works
- Step 1: Download the Excel file for Income Opportunity Realty Investors, Inc. (IOR).
- Step 2: Review IOR’s pre-filled financial data and forecasts.
- Step 3: Modify key inputs such as revenue growth, WACC, and tax rates (highlighted cells).
- Step 4: Observe the DCF model update in real-time as you adjust your assumptions.
- Step 5: Analyze the outputs and leverage the results for informed investment decisions.
Why Choose Income Opportunity Realty Investors, Inc. (IOR)?
- User-Friendly Interface: Tailored for both novice and seasoned investors.
- Customizable Parameters: Adjust inputs effortlessly to suit your financial assessments.
- Real-Time Insights: Watch immediate changes in IOR’s valuation as you modify inputs.
- Pre-Configured Data: Comes with IOR’s actual financial metrics for swift evaluations.
- Endorsed by Industry Experts: Favored by investors and analysts for making educated choices.
Who Should Use This Product?
- Investors: Accurately assess the fair value of Income Opportunity Realty Investors, Inc. (IOR) before making investment decisions.
- CFOs: Utilize a professional-grade DCF model for financial reporting and analysis specific to IOR.
- Consultants: Quickly customize the template for valuation reports tailored to clients interested in IOR.
- Entrepreneurs: Acquire insights into the financial modeling practices of successful real estate investment companies like IOR.
- Educators: Employ it as a teaching tool to illustrate valuation methodologies relevant to the real estate sector.
What the Template Contains
- Pre-Filled DCF Model: Income Opportunity Realty Investors, Inc.'s (IOR) financial data preloaded for immediate use.
- WACC Calculator: Detailed calculations for Weighted Average Cost of Capital.
- Financial Ratios: Evaluate IOR's profitability, leverage, and efficiency.
- Editable Inputs: Change assumptions such as growth, margins, and CAPEX to fit your scenarios.
- Financial Statements: Annual and quarterly reports to support detailed analysis.
- Interactive Dashboard: Easily visualize key valuation metrics and results.
Disclaimer
All information, articles, and product details provided on this website are for general informational and educational purposes only. We do not claim any ownership over, nor do we intend to infringe upon, any trademarks, copyrights, logos, brand names, or other intellectual property mentioned or depicted on this site. Such intellectual property remains the property of its respective owners, and any references here are made solely for identification or informational purposes, without implying any affiliation, endorsement, or partnership.
We make no representations or warranties, express or implied, regarding the accuracy, completeness, or suitability of any content or products presented. Nothing on this website should be construed as legal, tax, investment, financial, medical, or other professional advice. In addition, no part of this site—including articles or product references—constitutes a solicitation, recommendation, endorsement, advertisement, or offer to buy or sell any securities, franchises, or other financial instruments, particularly in jurisdictions where such activity would be unlawful.
All content is of a general nature and may not address the specific circumstances of any individual or entity. It is not a substitute for professional advice or services. Any actions you take based on the information provided here are strictly at your own risk. You accept full responsibility for any decisions or outcomes arising from your use of this website and agree to release us from any liability in connection with your use of, or reliance upon, the content or products found herein.