
|
IPG Photonics Corporation (IPGP) DCF -Bewertung |
Fully Editable: Tailor To Your Needs In Excel Or Sheets
Professional Design: Trusted, Industry-Standard Templates
Investor-Approved Valuation Models
MAC/PC Compatible, Fully Unlocked
No Expertise Is Needed; Easy To Follow
IPG Photonics Corporation (IPGP) Bundle
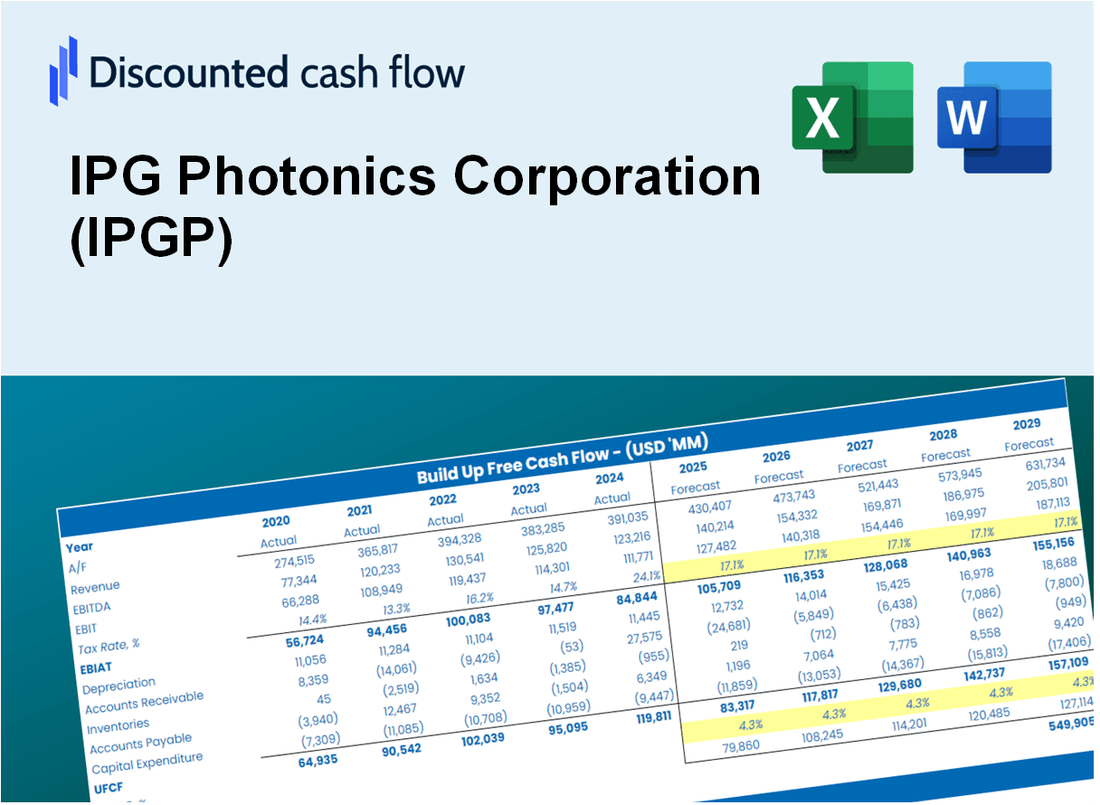
Unabhängig davon, ob Sie ein Anleger oder Analyst sind, ist dieser (IPGP) DCF-Taschenrechner Ihr Anlaufwerk für eine genaue Bewertung. Mit realen Daten von der IPG Photonics Corporation geladen, können Sie Prognosen anpassen und die Auswirkungen in Echtzeit beobachten.
Discounted Cash Flow (DCF) - (USD MM)
| Year | AY1 2020 |
AY2 2021 |
AY3 2022 |
AY4 2023 |
AY5 2024 |
FY1 2025 |
FY2 2026 |
FY3 2027 |
FY4 2028 |
FY5 2029 |
|---|---|---|---|---|---|---|---|---|---|---|
| Revenue | 1,200.7 | 1,460.9 | 1,429.5 | 1,287.4 | 977.1 | 941.7 | 907.5 | 874.5 | 842.8 | 812.2 |
| Revenue Growth, % | 0 | 21.66 | -2.14 | -9.94 | -24.1 | -3.63 | -3.63 | -3.63 | -3.63 | -3.63 |
| EBITDA | 326.1 | 449.1 | 322.0 | 301.2 | 75.9 | 210.1 | 202.5 | 195.2 | 188.1 | 181.3 |
| EBITDA, % | 27.16 | 30.74 | 22.52 | 23.39 | 7.77 | 22.32 | 22.32 | 22.32 | 22.32 | 22.32 |
| Depreciation | 94.6 | 96.3 | 90.6 | 69.6 | 61.4 | 61.2 | 59.0 | 56.8 | 54.8 | 52.8 |
| Depreciation, % | 7.87 | 6.59 | 6.34 | 5.41 | 6.29 | 6.5 | 6.5 | 6.5 | 6.5 | 6.5 |
| EBIT | 231.5 | 352.8 | 231.4 | 231.6 | 14.5 | 148.9 | 143.5 | 138.3 | 133.3 | 128.5 |
| EBIT, % | 19.28 | 24.15 | 16.19 | 17.99 | 1.48 | 15.82 | 15.82 | 15.82 | 15.82 | 15.82 |
| Total Cash | 1,391.1 | 1,514.5 | 1,177.6 | 1,177.5 | 930.2 | 883.3 | 851.3 | 820.4 | 790.6 | 761.9 |
| Total Cash, percent | .0 | .0 | .0 | .0 | .0 | .0 | .0 | .0 | .0 | .0 |
| Account Receivables | 264.3 | 262.1 | 211.3 | 219.1 | 171.1 | 168.1 | 162.0 | 156.1 | 150.5 | 145.0 |
| Account Receivables, % | 22.01 | 17.94 | 14.78 | 17.01 | 17.51 | 17.85 | 17.85 | 17.85 | 17.85 | 17.85 |
| Inventories | 365.0 | 460.7 | 509.4 | 453.9 | 284.8 | 305.0 | 294.0 | 283.3 | 273.0 | 263.1 |
| Inventories, % | 30.4 | 31.54 | 35.63 | 35.25 | 29.14 | 32.39 | 32.39 | 32.39 | 32.39 | 32.39 |
| Accounts Payable | 25.7 | 55.8 | 46.2 | 28.6 | 35.4 | 28.3 | 27.3 | 26.3 | 25.4 | 24.4 |
| Accounts Payable, % | 2.14 | 3.82 | 3.23 | 2.22 | 3.62 | 3.01 | 3.01 | 3.01 | 3.01 | 3.01 |
| Capital Expenditure | -87.7 | -123.1 | -110.1 | -110.5 | -98.5 | -79.3 | -76.4 | -73.6 | -71.0 | -68.4 |
| Capital Expenditure, % | -7.3 | -8.43 | -7.7 | -8.58 | -10.08 | -8.42 | -8.42 | -8.42 | -8.42 | -8.42 |
| Tax Rate, % | -12.13 | -12.13 | -12.13 | -12.13 | -12.13 | -12.13 | -12.13 | -12.13 | -12.13 | -12.13 |
| EBITAT | 179.6 | 268.0 | 138.7 | 184.4 | 16.2 | 117.1 | 112.9 | 108.8 | 104.8 | 101.0 |
| Depreciation | ||||||||||
| Changes in Account Receivables | ||||||||||
| Changes in Inventories | ||||||||||
| Changes in Accounts Payable | ||||||||||
| Capital Expenditure | ||||||||||
| UFCF | -417.1 | 177.8 | 111.7 | 173.7 | 202.9 | 74.7 | 111.6 | 107.5 | 103.6 | 99.9 |
| WACC, % | 8.53 | 8.53 | 8.52 | 8.53 | 8.53 | 8.53 | 8.53 | 8.53 | 8.53 | 8.53 |
| PV UFCF | ||||||||||
| SUM PV UFCF | 388.7 | |||||||||
| Long Term Growth Rate, % | 4.00 | |||||||||
| Free cash flow (T + 1) | 104 | |||||||||
| Terminal Value | 2,295 | |||||||||
| Present Terminal Value | 1,524 | |||||||||
| Enterprise Value | 1,913 | |||||||||
| Net Debt | -602 | |||||||||
| Equity Value | 2,515 | |||||||||
| Diluted Shares Outstanding, MM | 44 | |||||||||
| Equity Value Per Share | 56.73 |
What You Will Receive
- Genuine IPG Data: Preloaded financials – encompassing revenue through EBIT – derived from actual and projected figures.
- Complete Customization: Modify all essential parameters (yellow cells) such as WACC, growth %, and tax rates.
- Immediate Valuation Updates: Automatic recalculations to assess the effects of changes on IPG Photonics’ fair value.
- Flexible Excel Template: Designed for quick modifications, scenario analysis, and comprehensive projections.
- Efficient and Precise: Avoid the hassle of building models from scratch while ensuring accuracy and adaptability.
Key Features
- Customizable Forecast Inputs: Adjust essential factors such as revenue growth, gross margin %, and capital investments.
- Instant DCF Valuation: Quickly computes intrinsic value, NPV, and additional metrics with ease.
- High-Precision Accuracy: Leverages IPG Photonics' real-world financial data for credible valuation results.
- Simplified Scenario Analysis: Effortlessly evaluate various assumptions and analyze different outcomes.
- Efficiency Booster: Remove the necessity of constructing intricate valuation models from the ground up.
How It Works
- Step 1: Download the prebuilt Excel template featuring IPG Photonics Corporation’s (IPGP) data.
- Step 2: Navigate through the pre-filled sheets to familiarize yourself with the essential metrics.
- Step 3: Modify forecasts and assumptions in the editable yellow cells (WACC, growth, margins).
- Step 4: Instantly see the recalculated results, including IPG Photonics Corporation’s intrinsic value.
- Step 5: Utilize the outputs to make informed investment decisions or create detailed reports.
Why Choose This Calculator for IPG Photonics Corporation (IPGP)?
- Designed for Experts: A sophisticated tool utilized by financial analysts, CFOs, and industry consultants.
- Accurate Data: IPG Photonics' historical and projected financial data preloaded for precise analysis.
- Versatile Scenario Analysis: Effortlessly test various forecasts and assumptions.
- Comprehensive Outputs: Automatically computes intrinsic value, NPV, and essential financial metrics.
- User-Friendly Interface: Step-by-step guidance ensures a smooth calculation experience.
Who Should Use This Product?
- Investors: Accurately estimate IPG Photonics Corporation’s (IPGP) fair value before making investment decisions.
- CFOs: Utilize a professional-grade DCF model for financial reporting and analysis specific to IPGP.
- Consultants: Quickly customize the template for valuation reports tailored to IPG Photonics Corporation clients.
- Entrepreneurs: Gain insights into financial modeling practices employed by leading companies like IPGP.
- Educators: Use it as a teaching resource to illustrate valuation methodologies relevant to IPG Photonics Corporation.
What the Template Contains
- Operating and Balance Sheet Data: Pre-filled IPG Photonics Corporation (IPGP) historical data and forecasts, including revenue, EBITDA, EBIT, and capital expenditures.
- WACC Calculation: A dedicated sheet for Weighted Average Cost of Capital (WACC), including parameters like Beta, risk-free rate, and share price.
- DCF Valuation (Unlevered and Levered): Editable Discounted Cash Flow models showing intrinsic value with detailed calculations.
- Financial Statements: Pre-loaded financial statements (annual and quarterly) to support analysis.
- Key Ratios: Includes profitability, leverage, and efficiency ratios for IPG Photonics Corporation (IPGP).
- Dashboard and Charts: Visual summary of valuation outputs and assumptions to analyze results easily.
Disclaimer
All information, articles, and product details provided on this website are for general informational and educational purposes only. We do not claim any ownership over, nor do we intend to infringe upon, any trademarks, copyrights, logos, brand names, or other intellectual property mentioned or depicted on this site. Such intellectual property remains the property of its respective owners, and any references here are made solely for identification or informational purposes, without implying any affiliation, endorsement, or partnership.
We make no representations or warranties, express or implied, regarding the accuracy, completeness, or suitability of any content or products presented. Nothing on this website should be construed as legal, tax, investment, financial, medical, or other professional advice. In addition, no part of this site—including articles or product references—constitutes a solicitation, recommendation, endorsement, advertisement, or offer to buy or sell any securities, franchises, or other financial instruments, particularly in jurisdictions where such activity would be unlawful.
All content is of a general nature and may not address the specific circumstances of any individual or entity. It is not a substitute for professional advice or services. Any actions you take based on the information provided here are strictly at your own risk. You accept full responsibility for any decisions or outcomes arising from your use of this website and agree to release us from any liability in connection with your use of, or reliance upon, the content or products found herein.