
|
Iridium Communications Inc. (IRDM) DCF -Bewertung |
Fully Editable: Tailor To Your Needs In Excel Or Sheets
Professional Design: Trusted, Industry-Standard Templates
Investor-Approved Valuation Models
MAC/PC Compatible, Fully Unlocked
No Expertise Is Needed; Easy To Follow
Iridium Communications Inc. (IRDM) Bundle
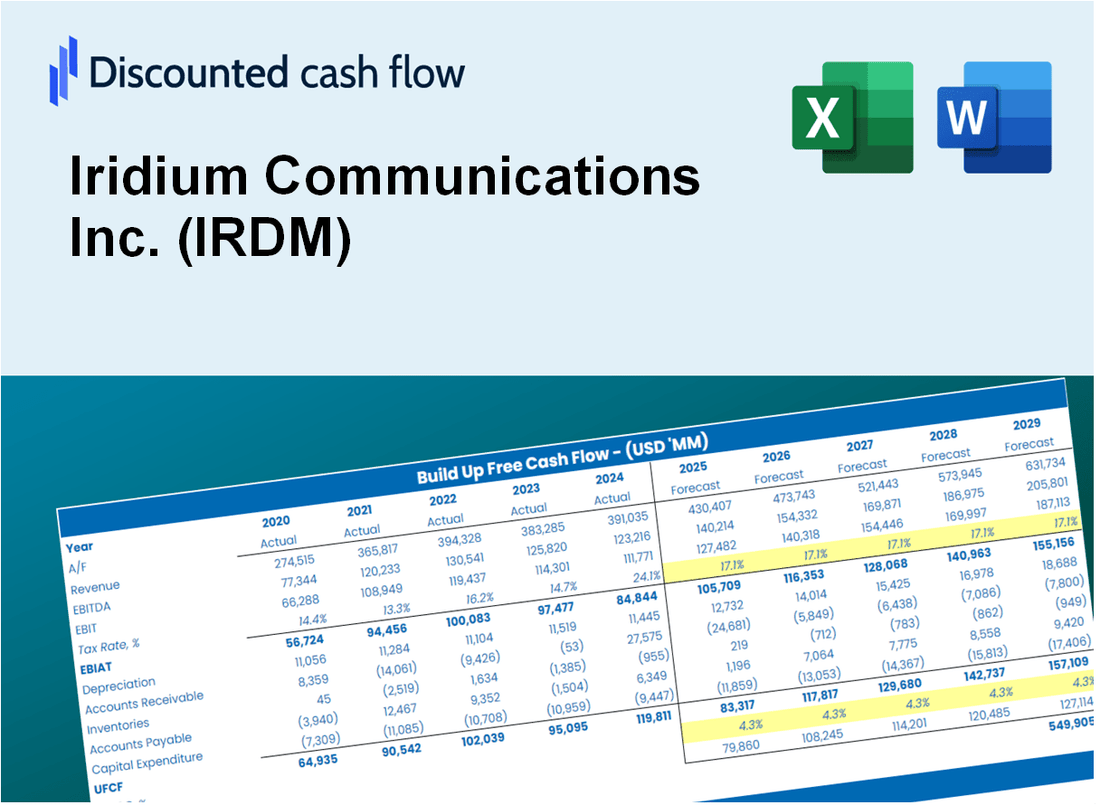
Verbessern Sie Ihre Investitionsauswahl mit dem DCF -Taschenrechner von Iridium Communications Inc. (IRDM)! Analysieren Sie echte Iridium -Finanzdaten, passen Sie Wachstumsprojektionen und -kosten an und beobachten Sie sofort, wie sich diese Modifikationen auf den inneren Wert von (IRDM) auswirken.
What You Will Get
- Editable Excel Template: A fully customizable Excel-based DCF Calculator featuring pre-filled real IRDM financials.
- Real-World Data: Historical data and forward-looking estimates (as indicated in the highlighted cells).
- Forecast Flexibility: Adjust forecast assumptions such as revenue growth, EBITDA %, and WACC.
- Automatic Calculations: Instantly observe the effect of your inputs on Iridium's valuation.
- Professional Tool: Designed for investors, CFOs, consultants, and financial analysts.
- User-Friendly Design: Organized for clarity and ease of use, complete with step-by-step instructions.
Key Features
- Comprehensive DCF Model: Features detailed unlevered and levered DCF valuation frameworks tailored for Iridium Communications Inc. (IRDM).
- WACC Analysis Tool: Pre-configured Weighted Average Cost of Capital template with adjustable parameters.
- Customizable Forecast Inputs: Adjust growth projections, capital investments, and discount rates as needed.
- Integrated Financial Ratios: Assess profitability, leverage, and efficiency ratios specifically for Iridium Communications Inc. (IRDM).
- Interactive Dashboard and Visuals: Graphical representations of key valuation indicators for straightforward analysis.
How It Works
- Download: Obtain the pre-configured Excel file containing Iridium Communications Inc.'s (IRDM) financial data.
- Customize: Modify forecasts, such as revenue growth, EBITDA %, and WACC to suit your analysis.
- Update Automatically: The calculations for intrinsic value and NPV refresh in real-time.
- Test Scenarios: Develop various projections and evaluate results immediately.
- Make Decisions: Leverage the valuation insights to inform your investment decisions.
Why Choose This Calculator for Iridium Communications Inc. (IRDM)?
- Accurate Data: Up-to-date Iridium financials provide trustworthy valuation outcomes.
- Customizable: Tailor essential parameters like growth rates, WACC, and tax rates to fit your forecasts.
- Time-Saving: Pre-configured calculations save you from starting from the ground up.
- Professional-Grade Tool: Crafted for investors, analysts, and consultants in the telecommunications sector.
- User-Friendly: Simple design and clear instructions ensure accessibility for all users.
Who Should Use This Product?
- Investors: Evaluate Iridium Communications Inc. (IRDM) for informed stock trading decisions.
- CFOs and Financial Analysts: Optimize valuation methodologies and validate financial forecasts.
- Startup Founders: Understand the valuation processes of established companies like Iridium Communications Inc. (IRDM).
- Consultants: Create detailed valuation reports to enhance client advisory services.
- Students and Educators: Utilize current market data to teach and practice valuation strategies.
What the Iridium Template Contains
- Comprehensive DCF Model: Editable template featuring detailed valuation calculations.
- Real-World Data: Iridium Communications Inc.'s (IRDM) historical and projected financials preloaded for analysis.
- Customizable Parameters: Adjust WACC, growth rates, and tax assumptions to explore different scenarios.
- Financial Statements: Complete annual and quarterly breakdowns for enhanced insights.
- Key Ratios: Integrated analysis for profitability, efficiency, and leverage metrics.
- Dashboard with Visual Outputs: Charts and tables designed for clear, actionable results.
Disclaimer
All information, articles, and product details provided on this website are for general informational and educational purposes only. We do not claim any ownership over, nor do we intend to infringe upon, any trademarks, copyrights, logos, brand names, or other intellectual property mentioned or depicted on this site. Such intellectual property remains the property of its respective owners, and any references here are made solely for identification or informational purposes, without implying any affiliation, endorsement, or partnership.
We make no representations or warranties, express or implied, regarding the accuracy, completeness, or suitability of any content or products presented. Nothing on this website should be construed as legal, tax, investment, financial, medical, or other professional advice. In addition, no part of this site—including articles or product references—constitutes a solicitation, recommendation, endorsement, advertisement, or offer to buy or sell any securities, franchises, or other financial instruments, particularly in jurisdictions where such activity would be unlawful.
All content is of a general nature and may not address the specific circumstances of any individual or entity. It is not a substitute for professional advice or services. Any actions you take based on the information provided here are strictly at your own risk. You accept full responsibility for any decisions or outcomes arising from your use of this website and agree to release us from any liability in connection with your use of, or reliance upon, the content or products found herein.