
|
Iris Energy Limited (IREN) DCF -Bewertung |
Fully Editable: Tailor To Your Needs In Excel Or Sheets
Professional Design: Trusted, Industry-Standard Templates
Investor-Approved Valuation Models
MAC/PC Compatible, Fully Unlocked
No Expertise Is Needed; Easy To Follow
Iris Energy Limited (IREN) Bundle
Unser (IREN) DCF-Taschenrechner (IREN) ermöglicht es Ihnen, die Bewertung von Iris Energy Limited mithilfe aktueller Finanzdaten zu bewerten und gleichzeitig alle wesentlichen Parameter für verbesserte Projektionen zu ändern.
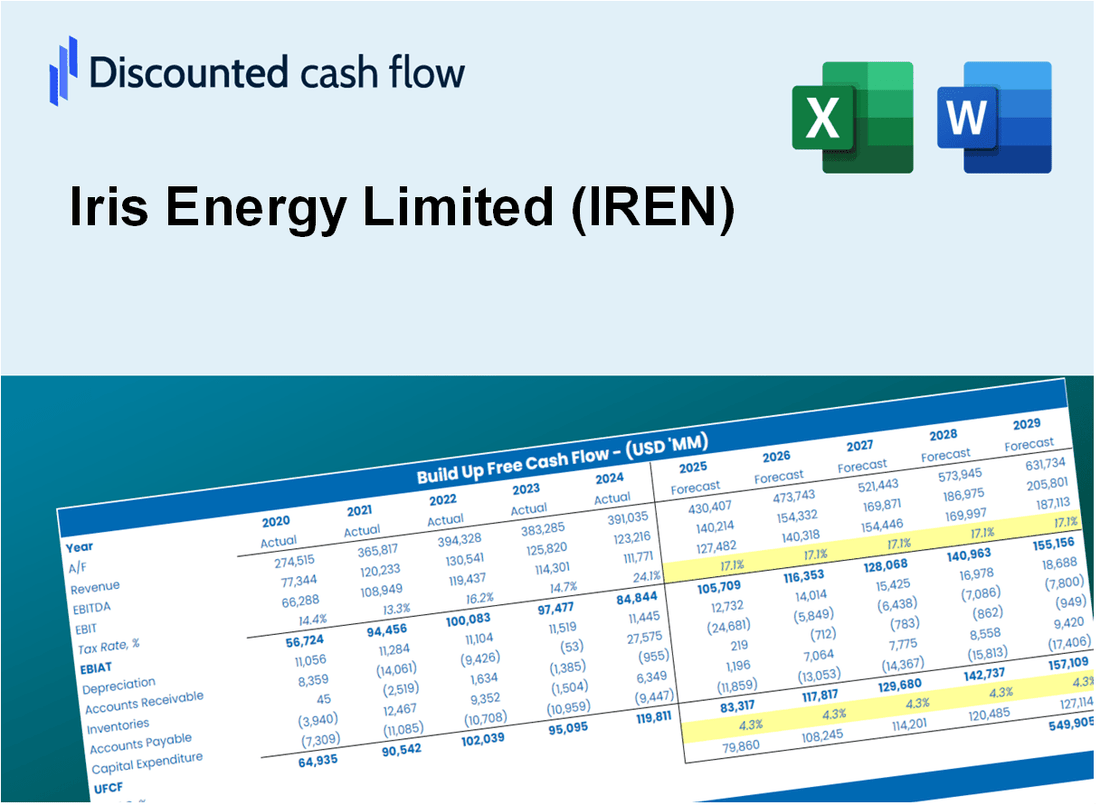
Discounted Cash Flow (DCF) - (USD MM)
| Year | AY1 2021 |
AY2 2022 |
AY3 2023 |
AY4 2024 |
AY5 2025 |
FY1 2026 |
FY2 2027 |
FY3 2028 |
FY4 2029 |
FY5 2030 |
|---|---|---|---|---|---|---|---|---|---|---|
| Revenue | 7.8 | 59.0 | 75.5 | 188.8 | 501.0 | 911.7 | 1,659.1 | 3,019.2 | 5,494.2 | 9,998.2 |
| Revenue Growth, % | 0 | 653.22 | 27.9 | 149.98 | 165.43 | 81.98 | 81.98 | 81.98 | 81.98 | 81.98 |
| EBITDA | -43.4 | -377.1 | -122.3 | 25.4 | 285.7 | -418.5 | -761.6 | -1,386.0 | -2,522.1 | -4,589.6 |
| EBITDA, % | -553.51 | -638.78 | -161.92 | 13.46 | 57.02 | -45.9 | -45.9 | -45.9 | -45.9 | -45.9 |
| Depreciation | .9 | 7.7 | 30.9 | 50.7 | 181.1 | 234.8 | 427.3 | 777.6 | 1,415.1 | 2,575.1 |
| Depreciation, % | 11.92 | 13.01 | 40.86 | 26.83 | 36.15 | 25.76 | 25.76 | 25.76 | 25.76 | 25.76 |
| EBIT | -44.3 | -384.8 | -153.1 | -25.2 | 104.5 | -533.4 | -970.6 | -1,766.3 | -3,214.2 | -5,849.1 |
| EBIT, % | -565.43 | -651.79 | -202.78 | -13.38 | 20.87 | -58.5 | -58.5 | -58.5 | -58.5 | -58.5 |
| Total Cash | 39.1 | 110.0 | 68.9 | 411.1 | 564.5 | 895.8 | 1,630.1 | 2,966.3 | 5,398.0 | 9,823.0 |
| Total Cash, percent | .0 | .0 | .0 | .0 | .0 | .0 | .0 | .0 | .0 | .0 |
| Account Receivables | .0 | .0 | 6.5 | 29.4 | 25.0 | 53.3 | 96.9 | 176.4 | 321.0 | 584.1 |
| Account Receivables, % | 0 | 0 | 8.67 | 15.56 | 4.99 | 5.84 | 5.84 | 5.84 | 5.84 | 5.84 |
| Inventories | .2 | .0 | .0 | .0 | .0 | 3.8 | 6.9 | 12.6 | 22.9 | 41.7 |
| Inventories, % | 2.08 | 0 | 0 | 0 | 0 | 0.417 | 0.417 | 0.417 | 0.417 | 0.417 |
| Accounts Payable | .5 | 13.2 | 11.5 | 27.3 | 81.7 | 137.6 | 250.4 | 455.6 | 829.1 | 1,508.8 |
| Accounts Payable, % | 6.95 | 22.41 | 15.29 | 14.49 | 16.32 | 15.09 | 15.09 | 15.09 | 15.09 | 15.09 |
| Capital Expenditure | -81.2 | -294.2 | -116.1 | -479.9 | -1,372.6 | -911.7 | -1,659.1 | -3,019.2 | -5,494.2 | -9,998.2 |
| Capital Expenditure, % | -1036.28 | -498.41 | -153.71 | -254.25 | -273.96 | -100 | -100 | -100 | -100 | -100 |
| Tax Rate, % | 7.02 | 7.02 | 7.02 | 7.02 | 7.02 | 7.02 | 7.02 | 7.02 | 7.02 | 7.02 |
| EBITAT | -45.2 | -387.3 | -155.3 | -28.7 | 97.2 | -525.9 | -957.0 | -1,741.5 | -3,169.1 | -5,767.0 |
| Depreciation | ||||||||||
| Changes in Account Receivables | ||||||||||
| Changes in Inventories | ||||||||||
| Changes in Accounts Payable | ||||||||||
| Capital Expenditure | ||||||||||
| UFCF | -125.2 | -661.0 | -248.7 | -464.9 | -1,035.5 | -1,179.1 | -2,122.8 | -3,863.0 | -7,029.7 | -12,792.3 |
| WACC, % | 22.21 | 22.21 | 22.21 | 22.21 | 22.2 | 22.21 | 22.21 | 22.21 | 22.21 | 22.21 |
| PV UFCF | ||||||||||
| SUM PV UFCF | -12,346.5 | |||||||||
| Long Term Growth Rate, % | 2.00 | |||||||||
| Free cash flow (T + 1) | -13,048 | |||||||||
| Terminal Value | -64,562 | |||||||||
| Present Terminal Value | -23,683 | |||||||||
| Enterprise Value | -36,030 | |||||||||
| Net Debt | 400 | |||||||||
| Equity Value | -36,429 | |||||||||
| Diluted Shares Outstanding, MM | 223 | |||||||||
| Equity Value Per Share | -163.18 |
What You Will Receive
- Comprehensive Financial Model: Utilize Iris Energy Limited’s (IREN) actual data for accurate DCF valuation.
- Complete Forecasting Control: Modify revenue growth, profit margins, WACC, and other essential factors.
- Real-Time Calculations: Instant updates ensure you receive immediate results as alterations are made.
- Professional-Grade Template: A polished Excel file crafted for high-quality valuation presentations.
- Flexible and Reusable: Designed for adaptability, allowing for repeated applications in detailed forecasting.
Key Features
- Accurate Financial Data: Gain access to reliable pre-loaded historical figures and future forecasts for Iris Energy Limited (IREN).
- Adjustable Forecast Parameters: Modify highlighted cells for key metrics such as WACC, growth rates, and profit margins.
- Real-Time Calculations: Enjoy automatic updates for DCF, Net Present Value (NPV), and cash flow assessments.
- User-Friendly Dashboard: Clear and concise charts and summaries to help visualize your valuation outcomes.
- Designed for All Levels: An intuitive layout tailored for investors, CFOs, and consultants alike.
How It Works
- Step 1: Download the prebuilt Excel template featuring Iris Energy Limited’s (IREN) data.
- Step 2: Navigate through the pre-filled sheets to familiarize yourself with the essential metrics.
- Step 3: Modify forecasts and assumptions in the editable yellow cells (WACC, growth, margins).
- Step 4: Instantly see the recalculated results, including Iris Energy Limited’s (IREN) intrinsic value.
- Step 5: Utilize the outputs to make informed investment decisions or create reports.
Why Choose This Calculator for Iris Energy Limited (IREN)?
- Accuracy: Utilizes real Iris Energy financials to ensure precise data.
- Flexibility: Built to allow users to easily test and adjust inputs.
- Time-Saving: Eliminate the need to create a DCF model from the ground up.
- Professional-Grade: Crafted with the precision and usability expected at the CFO level.
- User-Friendly: Intuitive design makes it accessible for users without extensive financial modeling skills.
Who Should Use This Product?
- Professional Investors: Develop comprehensive and accurate valuation models for analyzing portfolios involving Iris Energy Limited (IREN).
- Corporate Finance Teams: Evaluate valuation scenarios to inform strategic decisions within the company.
- Consultants and Advisors: Deliver precise valuation insights to clients regarding Iris Energy Limited (IREN) stock.
- Students and Educators: Utilize real-world data to enhance learning and practice in financial modeling.
- Energy Sector Enthusiasts: Gain insights into how renewable energy companies like Iris Energy Limited (IREN) are valued in the market.
What the Template Contains for Iris Energy Limited (IREN)
- Preloaded IREN Data: Historical and projected financial data, including revenue, EBIT, and capital expenditures.
- DCF and WACC Models: Professional-grade sheets for calculating intrinsic value and Weighted Average Cost of Capital.
- Editable Inputs: Yellow-highlighted cells for adjusting revenue growth, tax rates, and discount rates.
- Financial Statements: Comprehensive annual and quarterly financials for deeper analysis.
- Key Ratios: Profitability, leverage, and efficiency ratios to evaluate performance.
- Dashboard and Charts: Visual summaries of valuation outcomes and assumptions.
Disclaimer
All information, articles, and product details provided on this website are for general informational and educational purposes only. We do not claim any ownership over, nor do we intend to infringe upon, any trademarks, copyrights, logos, brand names, or other intellectual property mentioned or depicted on this site. Such intellectual property remains the property of its respective owners, and any references here are made solely for identification or informational purposes, without implying any affiliation, endorsement, or partnership.
We make no representations or warranties, express or implied, regarding the accuracy, completeness, or suitability of any content or products presented. Nothing on this website should be construed as legal, tax, investment, financial, medical, or other professional advice. In addition, no part of this site—including articles or product references—constitutes a solicitation, recommendation, endorsement, advertisement, or offer to buy or sell any securities, franchises, or other financial instruments, particularly in jurisdictions where such activity would be unlawful.
All content is of a general nature and may not address the specific circumstances of any individual or entity. It is not a substitute for professional advice or services. Any actions you take based on the information provided here are strictly at your own risk. You accept full responsibility for any decisions or outcomes arising from your use of this website and agree to release us from any liability in connection with your use of, or reliance upon, the content or products found herein.