
|
DCF -Bewertung der Emittenten Direct Corporation (ISDR) |
Fully Editable: Tailor To Your Needs In Excel Or Sheets
Professional Design: Trusted, Industry-Standard Templates
Investor-Approved Valuation Models
MAC/PC Compatible, Fully Unlocked
No Expertise Is Needed; Easy To Follow
Issuer Direct Corporation (ISDR) Bundle
Verbessern Sie Ihre Anlagestrategien mit dem DCF -Taschenrechner für Emittenten Direct Corporation (ISDR)! Erforschen Sie reale Finanzdaten für Apple, passen Sie die Wachstumsvorhersagen und -kosten an und beachten Sie sofort, wie sich diese Veränderungen auf den inneren Wert der Emittenten Direct Corporation (ISDR) auswirken.
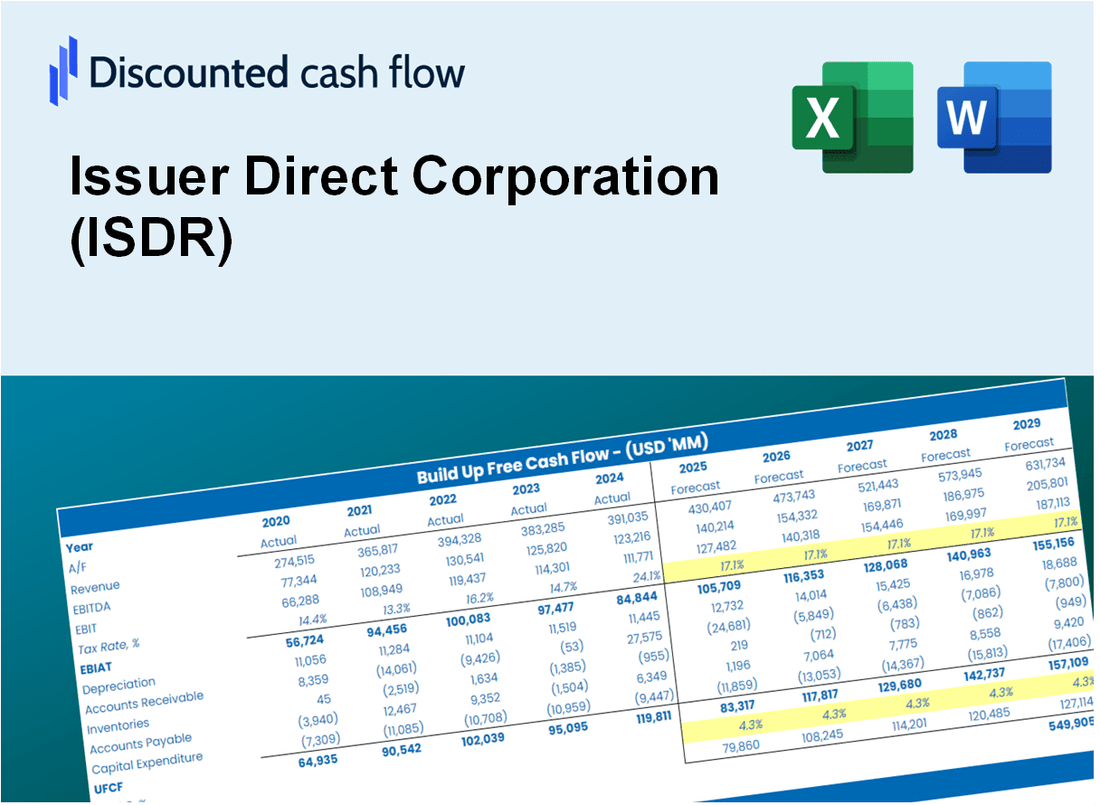
Discounted Cash Flow (DCF) - (USD MM)
| Year | AY1 2019 |
AY2 2020 |
AY3 2021 |
AY4 2022 |
AY5 2023 |
FY1 2024 |
FY2 2025 |
FY3 2026 |
FY4 2027 |
FY5 2028 |
|---|---|---|---|---|---|---|---|---|---|---|
| Revenue | 16.3 | 18.5 | 21.9 | 23.5 | 33.4 | 33.7 | 34.1 | 34.4 | 34.8 | 35.1 |
| Revenue Growth, % | 0 | 13.69 | 18.12 | 7.45 | 41.95 | 1.03 | 1.03 | 1.03 | 1.03 | 1.03 |
| EBITDA | 2.1 | 4.0 | 4.9 | 3.7 | 5.4 | 6.0 | 6.1 | 6.1 | 6.2 | 6.3 |
| EBITDA, % | 13.14 | 21.82 | 22.33 | 15.74 | 16.12 | 17.83 | 17.83 | 17.83 | 17.83 | 17.83 |
| Depreciation | 1.7 | 1.3 | 1.1 | 1.0 | 3.0 | 2.4 | 2.5 | 2.5 | 2.5 | 2.5 |
| Depreciation, % | 10.23 | 7.28 | 5.22 | 4.39 | 8.86 | 7.2 | 7.2 | 7.2 | 7.2 | 7.2 |
| EBIT | .5 | 2.7 | 3.7 | 2.7 | 2.4 | 3.6 | 3.6 | 3.7 | 3.7 | 3.7 |
| EBIT, % | 2.91 | 14.54 | 17.1 | 11.35 | 7.27 | 10.63 | 10.63 | 10.63 | 10.63 | 10.63 |
| Total Cash | 15.8 | 19.6 | 23.9 | 4.8 | 5.7 | 22.6 | 22.8 | 23.0 | 23.3 | 23.5 |
| Total Cash, percent | .0 | .0 | .0 | .0 | .0 | .0 | .0 | .0 | .0 | .0 |
| Account Receivables | 2.1 | 2.5 | 3.3 | 3.0 | 4.6 | 4.6 | 4.6 | 4.7 | 4.7 | 4.8 |
| Account Receivables, % | 12.88 | 13.57 | 15.04 | 12.88 | 13.78 | 13.63 | 13.63 | 13.63 | 13.63 | 13.63 |
| Inventories | .0 | .0 | .0 | .0 | .0 | .0 | .0 | .0 | .0 | .0 |
| Inventories, % | 0 | 0.000005397819 | 0 | 0.000004252786 | 0 | 0.000001930121 | 0.000001930121 | 0.000001930121 | 0.000001930121 | 0.000001930121 |
| Accounts Payable | .3 | .3 | .7 | 1.4 | 1.3 | 1.1 | 1.1 | 1.1 | 1.1 | 1.1 |
| Accounts Payable, % | 1.63 | 1.64 | 3.18 | 5.84 | 3.92 | 3.24 | 3.24 | 3.24 | 3.24 | 3.24 |
| Capital Expenditure | -.4 | .0 | -.3 | -.1 | -.5 | -.4 | -.4 | -.4 | -.4 | -.4 |
| Capital Expenditure, % | -2.7 | -0.14574 | -1.27 | -0.28068 | -1.51 | -1.18 | -1.18 | -1.18 | -1.18 | -1.18 |
| Tax Rate, % | 41.48 | 41.48 | 41.48 | 41.48 | 41.48 | 41.48 | 41.48 | 41.48 | 41.48 | 41.48 |
| EBITAT | .4 | 2.0 | 3.0 | 1.9 | 1.4 | 2.7 | 2.7 | 2.7 | 2.8 | 2.8 |
| Depreciation | ||||||||||
| Changes in Account Receivables | ||||||||||
| Changes in Inventories | ||||||||||
| Changes in Accounts Payable | ||||||||||
| Capital Expenditure | ||||||||||
| UFCF | -.2 | 2.9 | 3.5 | 3.9 | 2.2 | 4.5 | 4.7 | 4.8 | 4.8 | 4.9 |
| WACC, % | 6.74 | 6.5 | 6.62 | 6.47 | 6.17 | 6.5 | 6.5 | 6.5 | 6.5 | 6.5 |
| PV UFCF | ||||||||||
| SUM PV UFCF | 19.6 | |||||||||
| Long Term Growth Rate, % | 3.50 | |||||||||
| Free cash flow (T + 1) | 5 | |||||||||
| Terminal Value | 167 | |||||||||
| Present Terminal Value | 122 | |||||||||
| Enterprise Value | 142 | |||||||||
| Net Debt | 15 | |||||||||
| Equity Value | 127 | |||||||||
| Diluted Shares Outstanding, MM | 4 | |||||||||
| Equity Value Per Share | 33.18 |
What You Will Get
- Comprehensive ISDR Financials: Access to both historical and projected data for precise valuation.
- Customizable Inputs: Adjust WACC, tax rates, revenue growth, and capital expenditures to fit your analysis.
- Dynamic Calculations: Intrinsic value and NPV are computed in real-time.
- Scenario Analysis: Evaluate various scenarios to assess Issuer Direct's future performance.
- User-Friendly Interface: Designed for professionals while remaining accessible to newcomers.
Key Features
- Comprehensive Financial Data: Gain access to reliable pre-loaded historical performance and future outlooks for Issuer Direct Corporation (ISDR).
- Adjustable Forecast Parameters: Modify highlighted fields such as WACC, growth rates, and profit margins to suit your analysis.
- Real-Time Calculations: Instant updates for DCF, Net Present Value (NPV), and cash flow assessments.
- Interactive Dashboard: User-friendly graphs and summaries to help you interpret your valuation findings.
- Designed for All Skill Levels: An accessible, straightforward layout tailored for investors, CFOs, and consultants alike.
How It Works
- Step 1: Download the prebuilt Excel template featuring Issuer Direct Corporation’s (ISDR) data.
- Step 2: Navigate through the pre-filled sheets to familiarize yourself with the essential metrics.
- Step 3: Modify forecasts and assumptions in the editable yellow cells (WACC, growth, margins).
- Step 4: Instantly view the updated results, including Issuer Direct Corporation’s (ISDR) intrinsic value.
- Step 5: Make well-informed investment choices or create reports using the generated outputs.
Why Choose Issuer Direct Corporation (ISDR)?
- Streamlined Processes: Eliminate the hassle of complex reporting – our solutions are ready to implement.
- Enhanced Accuracy: Dependable data and methodologies minimize discrepancies in your financial reporting.
- Completely Adaptable: Modify our tools to align with your specific requirements and forecasts.
- User-Friendly Interface: Intuitive dashboards and outputs simplify data interpretation.
- Preferred by Professionals: Crafted for experts who prioritize accuracy and functionality.
Who Should Use This Product?
- Investors: Accurately assess Issuer Direct Corporation’s (ISDR) fair value prior to making investment choices.
- CFOs: Utilize a high-quality DCF model for comprehensive financial reporting and analysis.
- Consultants: Efficiently customize the template for client valuation reports.
- Entrepreneurs: Acquire knowledge about financial modeling practices employed by leading companies.
- Educators: Implement it as a teaching resource to illustrate various valuation techniques.
What the Template Contains
- Preloaded ISDR Data: Historical and projected financial data, including revenue, EBIT, and capital expenditures.
- DCF and WACC Models: Professional-grade sheets for calculating intrinsic value and Weighted Average Cost of Capital.
- Editable Inputs: Yellow-highlighted cells for adjusting revenue growth, tax rates, and discount rates.
- Financial Statements: Comprehensive annual and quarterly financials for deeper analysis.
- Key Ratios: Profitability, leverage, and efficiency ratios to evaluate performance.
- Dashboard and Charts: Visual summaries of valuation outcomes and assumptions.
Disclaimer
All information, articles, and product details provided on this website are for general informational and educational purposes only. We do not claim any ownership over, nor do we intend to infringe upon, any trademarks, copyrights, logos, brand names, or other intellectual property mentioned or depicted on this site. Such intellectual property remains the property of its respective owners, and any references here are made solely for identification or informational purposes, without implying any affiliation, endorsement, or partnership.
We make no representations or warranties, express or implied, regarding the accuracy, completeness, or suitability of any content or products presented. Nothing on this website should be construed as legal, tax, investment, financial, medical, or other professional advice. In addition, no part of this site—including articles or product references—constitutes a solicitation, recommendation, endorsement, advertisement, or offer to buy or sell any securities, franchises, or other financial instruments, particularly in jurisdictions where such activity would be unlawful.
All content is of a general nature and may not address the specific circumstances of any individual or entity. It is not a substitute for professional advice or services. Any actions you take based on the information provided here are strictly at your own risk. You accept full responsibility for any decisions or outcomes arising from your use of this website and agree to release us from any liability in connection with your use of, or reliance upon, the content or products found herein.