
|
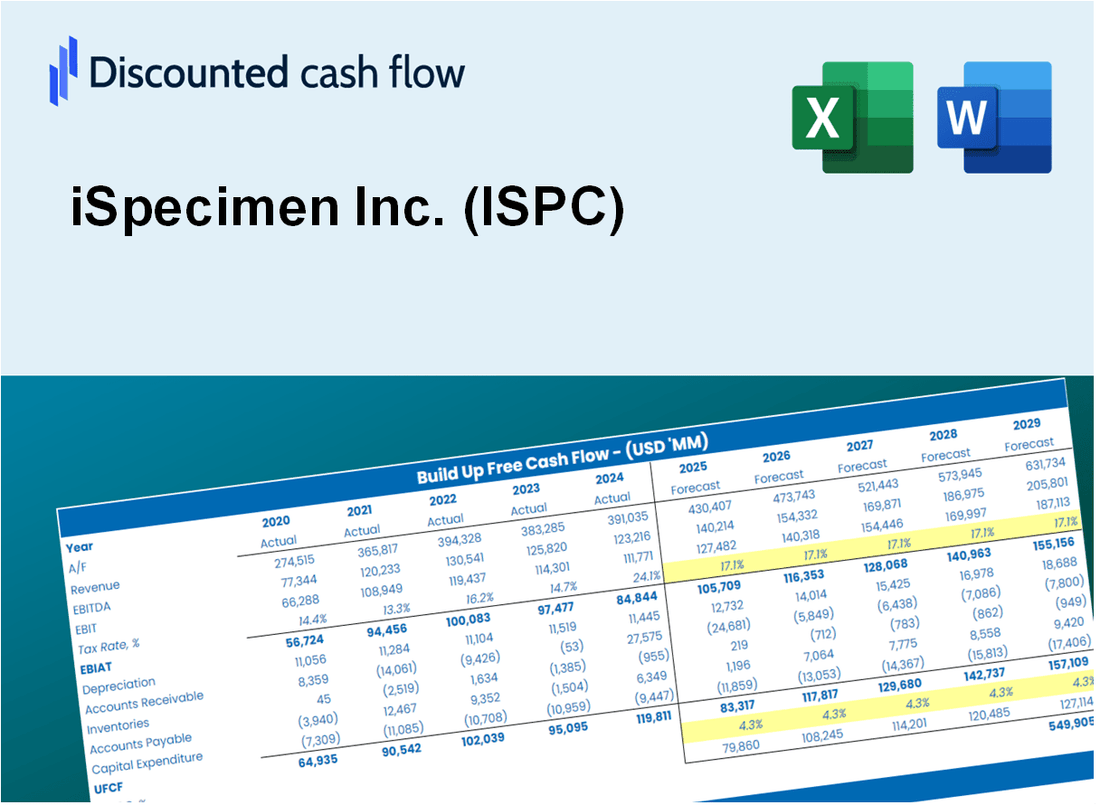
ISPecimen Inc. (ISPC) DCF -Bewertung |
Fully Editable: Tailor To Your Needs In Excel Or Sheets
Professional Design: Trusted, Industry-Standard Templates
Investor-Approved Valuation Models
MAC/PC Compatible, Fully Unlocked
No Expertise Is Needed; Easy To Follow
iSpecimen Inc. (ISPC) Bundle
Streamline ISPecimen Inc. (ISPC) Bewertung mit unserem anpassbaren DCF -Taschenrechner! Unter Verwendung realer ispecimen -Finanzdaten und einstellbarer Prognoseparameter können Sie verschiedene Szenarien untersuchen und in nur wenigen Minuten den beizulegenden Zeitwert von ISspecimen ermitteln.
What You Will Get
- Comprehensive ISPC Financials: Access to both historical and projected data for precise valuation.
- Customizable Parameters: Adjust WACC, tax rates, revenue growth, and capital expenditures as needed.
- Dynamic Calculations: Intrinsic value and NPV are computed in real-time.
- Scenario Analysis: Evaluate various scenarios to assess iSpecimen's future performance.
- User-Friendly Design: Designed for industry professionals while remaining approachable for newcomers.
Key Features
- Customizable Data Inputs: Adjust essential parameters such as specimen availability, market demand, and pricing strategies.
- Instant Market Analysis: Provides real-time insights into market trends and competitive positioning.
- High-Precision Analytics: Leverages iSpecimen’s extensive data for accurate market forecasts and strategic planning.
- Effortless Scenario Simulation: Easily explore various market conditions and analyze potential impacts.
- Efficiency Booster: Streamlines the process of data management and analysis, saving valuable time.
How It Works
- Step 1: Download the prebuilt Excel template with iSpecimen Inc.'s (ISPC) data included.
- Step 2: Explore the pre-filled sheets and familiarize yourself with the essential metrics.
- Step 3: Update forecasts and assumptions in the editable yellow cells (WACC, growth, margins).
- Step 4: Instantly view recalculated results, including iSpecimen Inc.'s (ISPC) intrinsic value.
- Step 5: Make informed investment decisions or generate reports using the outputs.
Why Choose iSpecimen Inc. (ISPC)?
- Innovative Solutions: Provides a comprehensive platform for specimen sourcing and management.
- Flexible Options: Tailor your specimen requests to meet specific research needs and requirements.
- In-Depth Analytics: Access detailed insights into specimen availability and historical data trends.
- Robust Database: A vast collection of specimens ensures a wide range of options for researchers.
- Expert Support: Backed by a team of professionals dedicated to assisting clients in their research endeavors.
Who Should Use This Product?
- Investors: Accurately assess iSpecimen Inc.'s (ISPC) market potential before making investment choices.
- CFOs: Utilize a professional-grade DCF model for precise financial reporting and analysis.
- Consultants: Effortlessly customize the template for client valuation reports.
- Entrepreneurs: Discover financial modeling techniques employed by leading biotech firms.
- Educators: Implement it as a teaching resource to illustrate valuation methods.
What the Template Contains
- Historical Data: Includes iSpecimen Inc.'s (ISPC) past financials and baseline forecasts.
- DCF and Levered DCF Models: Detailed templates to calculate iSpecimen Inc.'s (ISPC) intrinsic value.
- WACC Sheet: Pre-built calculations for Weighted Average Cost of Capital.
- Editable Inputs: Modify key drivers like growth rates, EBITDA %, and CAPEX assumptions.
- Quarterly and Annual Statements: A complete breakdown of iSpecimen Inc.'s (ISPC) financials.
- Interactive Dashboard: Visualize valuation results and projections dynamically.
Disclaimer
All information, articles, and product details provided on this website are for general informational and educational purposes only. We do not claim any ownership over, nor do we intend to infringe upon, any trademarks, copyrights, logos, brand names, or other intellectual property mentioned or depicted on this site. Such intellectual property remains the property of its respective owners, and any references here are made solely for identification or informational purposes, without implying any affiliation, endorsement, or partnership.
We make no representations or warranties, express or implied, regarding the accuracy, completeness, or suitability of any content or products presented. Nothing on this website should be construed as legal, tax, investment, financial, medical, or other professional advice. In addition, no part of this site—including articles or product references—constitutes a solicitation, recommendation, endorsement, advertisement, or offer to buy or sell any securities, franchises, or other financial instruments, particularly in jurisdictions where such activity would be unlawful.
All content is of a general nature and may not address the specific circumstances of any individual or entity. It is not a substitute for professional advice or services. Any actions you take based on the information provided here are strictly at your own risk. You accept full responsibility for any decisions or outcomes arising from your use of this website and agree to release us from any liability in connection with your use of, or reliance upon, the content or products found herein.