
|
Iteos Therapeutics, Inc. (ITOS) DCF -Bewertung |
Fully Editable: Tailor To Your Needs In Excel Or Sheets
Professional Design: Trusted, Industry-Standard Templates
Investor-Approved Valuation Models
MAC/PC Compatible, Fully Unlocked
No Expertise Is Needed; Easy To Follow
iTeos Therapeutics, Inc. (ITOS) Bundle
Bewerten Sie ITEOS Therapeutics, Inc. (ITOS) finanzielle Aussichten wie ein Experte! Dieser (ITOS) DCF-Taschenrechner bietet Ihnen vorgefüllte Finanzdaten und vollständige Flexibilität, um das Umsatzwachstum, WACC, Margen und andere wesentliche Annahmen zu ändern, um sich an Ihren Vorhersagen auszurichten.
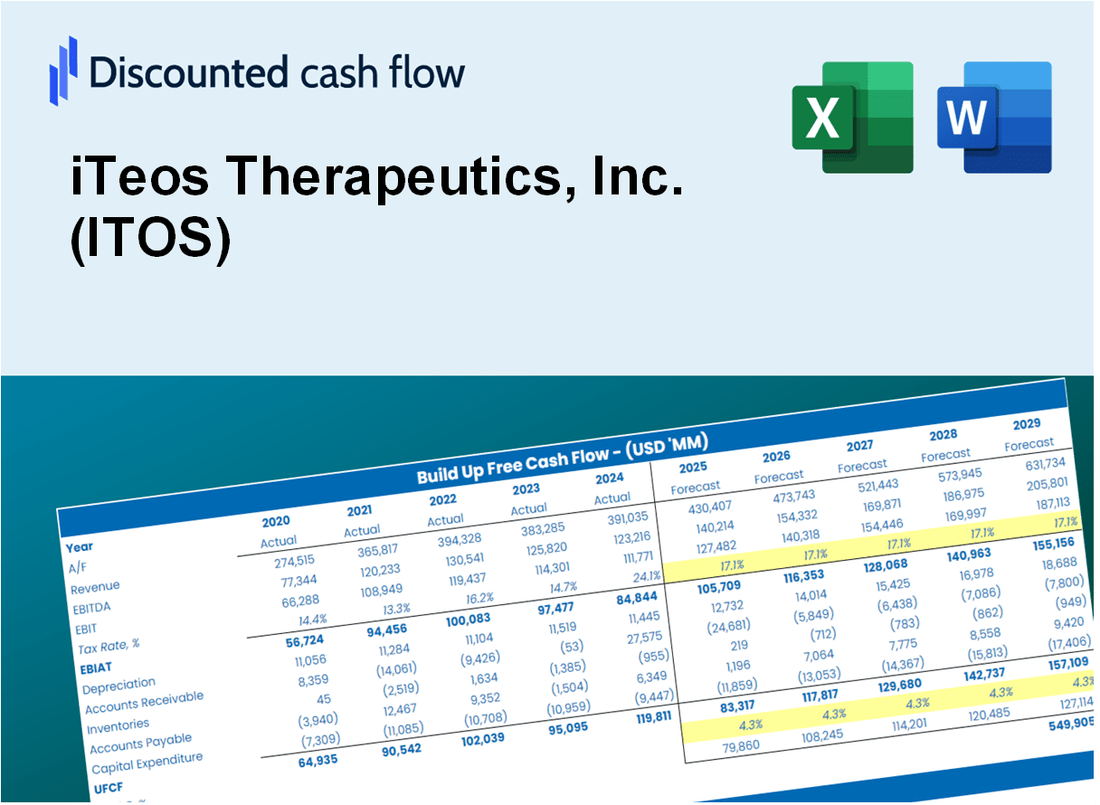
Discounted Cash Flow (DCF) - (USD MM)
| Year | AY1 2020 |
AY2 2021 |
AY3 2022 |
AY4 2023 |
AY5 2024 |
FY1 2025 |
FY2 2026 |
FY3 2027 |
FY4 2028 |
FY5 2029 |
|---|---|---|---|---|---|---|---|---|---|---|
| Revenue | .0 | 344.8 | 267.6 | 12.6 | 35.0 | 33.5 | 32.0 | 30.6 | 29.2 | 27.9 |
| Revenue Growth, % | 0 | 0 | -22.38 | -95.29 | 177.89 | -4.42 | -4.42 | -4.42 | -4.42 | -4.42 |
| EBITDA | -37.8 | 257.1 | 148.4 | -111.7 | -121.8 | 2.0 | 1.9 | 1.8 | 1.8 | 1.7 |
| EBITDA, % | 100 | 74.56 | 55.44 | -886.53 | -348.07 | 6 | 6 | 6 | 6 | 6 |
| Depreciation | .5 | .6 | .8 | .9 | 1.2 | 7.4 | 7.1 | 6.8 | 6.5 | 6.2 |
| Depreciation, % | 100 | 0.17838 | 0.30378 | 7.13 | 3.54 | 22.23 | 22.23 | 22.23 | 22.23 | 22.23 |
| EBIT | -38.4 | 256.5 | 147.6 | -112.6 | -123.1 | 2.0 | 1.9 | 1.8 | 1.7 | 1.6 |
| EBIT, % | 100 | 74.39 | 55.14 | -893.66 | -351.6 | 5.9 | 5.9 | 5.9 | 5.9 | 5.9 |
| Total Cash | 336.3 | 848.5 | 613.2 | 531.9 | 494.6 | 33.5 | 32.0 | 30.6 | 29.2 | 27.9 |
| Total Cash, percent | .0 | .0 | .0 | .0 | .0 | .0 | .0 | .0 | .0 | .0 |
| Account Receivables | .3 | 12.1 | 2.4 | 6.5 | 3.7 | 11.1 | 10.7 | 10.2 | 9.7 | 9.3 |
| Account Receivables, % | 100 | 3.51 | 0.90984 | 51.61 | 10.55 | 33.31 | 33.31 | 33.31 | 33.31 | 33.31 |
| Inventories | -.3 | .0 | .0 | .0 | .0 | 6.7 | 6.4 | 6.1 | 5.8 | 5.6 |
| Inventories, % | 100 | 0 | 0 | 0 | 0 | 20 | 20 | 20 | 20 | 20 |
| Accounts Payable | 3.0 | 5.1 | 7.7 | 11.3 | 8.5 | 14.6 | 14.0 | 13.3 | 12.8 | 12.2 |
| Accounts Payable, % | 100 | 1.49 | 2.86 | 89.66 | 24.29 | 43.66 | 43.66 | 43.66 | 43.66 | 43.66 |
| Capital Expenditure | -.4 | -1.2 | -.9 | -3.0 | -1.6 | -1.9 | -1.8 | -1.8 | -1.7 | -1.6 |
| Capital Expenditure, % | 100 | -0.34254 | -0.35048 | -23.55 | -4.67 | -5.78 | -5.78 | -5.78 | -5.78 | -5.78 |
| Tax Rate, % | -11.69 | -11.69 | -11.69 | -11.69 | -11.69 | -11.69 | -11.69 | -11.69 | -11.69 | -11.69 |
| EBITAT | -38.0 | 214.5 | 96.7 | -116.3 | -137.5 | 1.8 | 1.7 | 1.6 | 1.5 | 1.5 |
| Depreciation | ||||||||||
| Changes in Account Receivables | ||||||||||
| Changes in Inventories | ||||||||||
| Changes in Accounts Payable | ||||||||||
| Capital Expenditure | ||||||||||
| UFCF | -34.8 | 204.0 | 108.7 | -118.8 | -137.8 | -.8 | 7.1 | 6.8 | 6.5 | 6.2 |
| WACC, % | 10.57 | 10.56 | 10.56 | 10.57 | 10.57 | 10.57 | 10.57 | 10.57 | 10.57 | 10.57 |
| PV UFCF | ||||||||||
| SUM PV UFCF | 18.2 | |||||||||
| Long Term Growth Rate, % | 2.00 | |||||||||
| Free cash flow (T + 1) | 6 | |||||||||
| Terminal Value | 74 | |||||||||
| Present Terminal Value | 45 | |||||||||
| Enterprise Value | 63 | |||||||||
| Net Debt | -137 | |||||||||
| Equity Value | 200 | |||||||||
| Diluted Shares Outstanding, MM | 40 | |||||||||
| Equity Value Per Share | 4.94 |
What You Will Get
- Real ITOS Financial Data: Pre-filled with iTeos Therapeutics' historical and projected data for precise analysis.
- Fully Editable Template: Modify key inputs like revenue growth, WACC, and EBITDA % with ease.
- Automatic Calculations: See iTeos Therapeutics' intrinsic value update instantly based on your changes.
- Professional Valuation Tool: Designed for investors, analysts, and consultants seeking accurate DCF results.
- User-Friendly Design: Simple structure and clear instructions for all experience levels.
Key Features
- Comprehensive Data: iTeos Therapeutics’ historical financial records and pre-filled projections.
- Customizable Parameters: Adjust WACC, tax rates, revenue growth, and EBITDA margins as needed.
- Real-Time Insights: View iTeos Therapeutics’ intrinsic value recalculating instantly.
- Intuitive Visualizations: Dashboard graphs illustrate valuation outcomes and essential metrics.
- Designed for Precision: A professional-grade tool for analysts, investors, and finance professionals.
How It Works
- Download: Obtain the pre-prepared Excel file featuring iTeos Therapeutics, Inc.'s (ITOS) financial data.
- Customize: Modify projections, including revenue growth, EBITDA %, and WACC.
- Update Automatically: The intrinsic value and NPV calculations refresh in real-time.
- Test Scenarios: Develop various projections and instantly compare the results.
- Make Decisions: Utilize the valuation outcomes to inform your investment strategy.
Why Choose This Calculator for iTeos Therapeutics, Inc. (ITOS)?
- Comprehensive Tool: Features DCF, WACC, and financial ratio analyses tailored for biopharmaceuticals.
- Customizable Inputs: Modify yellow-highlighted cells to explore different investment scenarios.
- Detailed Insights: Automatically computes iTeos Therapeutics’ intrinsic value and Net Present Value.
- Preloaded Data: Historical and projected data provide a solid foundation for analysis.
- Professional Quality: Perfect for financial analysts, investors, and biotech consultants.
Who Should Use iTeos Therapeutics, Inc. (ITOS)?
- Investors: Gain insights into innovative therapeutic solutions for informed investment choices.
- Healthcare Analysts: Utilize comprehensive data to evaluate the potential of cutting-edge biopharmaceuticals.
- Consultants: Tailor presentations and reports with up-to-date information on iTeos' product pipeline.
- Biotech Enthusiasts: Explore the latest advancements in immunotherapy and cancer treatment through real-world applications.
- Educators and Students: Leverage case studies and research from iTeos as a resource in life sciences education.
What the Template Contains
- Operating and Balance Sheet Data: Pre-filled iTeos Therapeutics historical data and forecasts, including revenue, EBITDA, EBIT, and capital expenditures.
- WACC Calculation: A dedicated sheet for Weighted Average Cost of Capital (WACC), including parameters like Beta, risk-free rate, and share price.
- DCF Valuation (Unlevered and Levered): Editable Discounted Cash Flow models showing intrinsic value with detailed calculations.
- Financial Statements: Pre-loaded financial statements (annual and quarterly) to support analysis.
- Key Ratios: Includes profitability, leverage, and efficiency ratios for iTeos Therapeutics, Inc. (ITOS).
- Dashboard and Charts: Visual summary of valuation outputs and assumptions to analyze results easily.
Disclaimer
All information, articles, and product details provided on this website are for general informational and educational purposes only. We do not claim any ownership over, nor do we intend to infringe upon, any trademarks, copyrights, logos, brand names, or other intellectual property mentioned or depicted on this site. Such intellectual property remains the property of its respective owners, and any references here are made solely for identification or informational purposes, without implying any affiliation, endorsement, or partnership.
We make no representations or warranties, express or implied, regarding the accuracy, completeness, or suitability of any content or products presented. Nothing on this website should be construed as legal, tax, investment, financial, medical, or other professional advice. In addition, no part of this site—including articles or product references—constitutes a solicitation, recommendation, endorsement, advertisement, or offer to buy or sell any securities, franchises, or other financial instruments, particularly in jurisdictions where such activity would be unlawful.
All content is of a general nature and may not address the specific circumstances of any individual or entity. It is not a substitute for professional advice or services. Any actions you take based on the information provided here are strictly at your own risk. You accept full responsibility for any decisions or outcomes arising from your use of this website and agree to release us from any liability in connection with your use of, or reliance upon, the content or products found herein.