
|
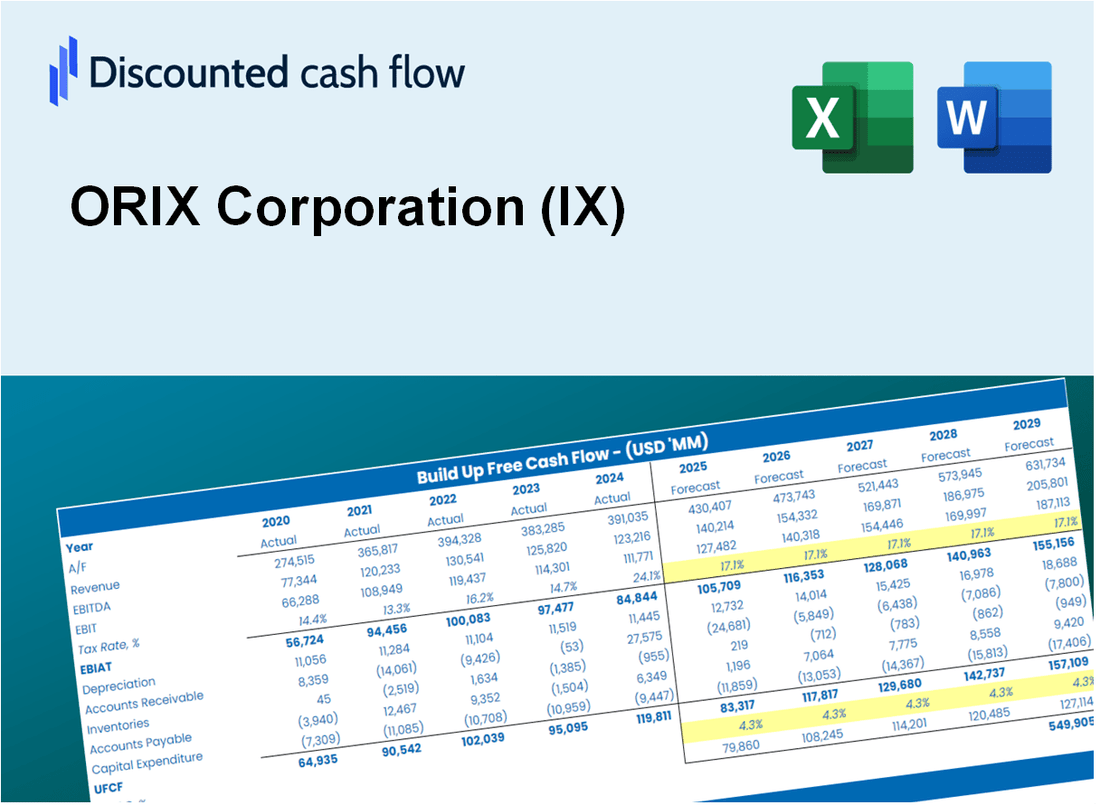
DCF -Bewertung der ORIX Corporation (IX) |
Fully Editable: Tailor To Your Needs In Excel Or Sheets
Professional Design: Trusted, Industry-Standard Templates
Investor-Approved Valuation Models
MAC/PC Compatible, Fully Unlocked
No Expertise Is Needed; Easy To Follow
ORIX Corporation (IX) Bundle
Gewinnen Sie Einblicke in Ihre ORIX Corporation-Bewertungsanalyse (IX) mit unserem hochmodernen DCF-Taschenrechner! Diese Excel -Vorlage wird mit genauen IX -Daten vorinstalliert, sodass Sie Prognosen und Annahmen anpassen können, um den inneren Wert der ORIX Corporation genau zu bestimmen.
What You Will Receive
- Flexible Forecast Inputs: Effortlessly modify assumptions (growth %, margins, WACC) to explore various scenarios.
- Comprehensive Data: ORIX Corporation’s financial data pre-loaded to facilitate your analysis.
- Automated DCF Calculations: The template computes Net Present Value (NPV) and intrinsic value automatically.
- Tailored and Professional: A refined Excel model that adjusts to your valuation requirements.
- Designed for Analysts and Investors: Perfect for evaluating projections, confirming strategies, and optimizing time.
Key Features
- Comprehensive DCF Calculator: Offers detailed unlevered and levered DCF valuation models tailored for ORIX Corporation (IX).
- WACC Calculator: Comes with a pre-built Weighted Average Cost of Capital sheet featuring customizable inputs for precise calculations.
- Customizable Forecast Assumptions: Adjust growth rates, capital expenditures, and discount rates to fit your analysis needs.
- Integrated Financial Ratios: Evaluate profitability, leverage, and efficiency ratios specifically for ORIX Corporation (IX).
- User-Friendly Dashboard and Charts: Visual representations summarize essential valuation metrics for streamlined analysis.
How It Works
- Step 1: Download the prebuilt Excel template featuring ORIX Corporation’s (IX) data.
- Step 2: Navigate through the pre-filled sheets to familiarize yourself with the essential metrics.
- Step 3: Modify forecasts and assumptions in the editable yellow cells (WACC, growth, margins).
- Step 4: Instantly see the recalculated results, including ORIX Corporation’s (IX) intrinsic value.
- Step 5: Use the outputs to make informed investment decisions or create detailed reports.
Why Choose ORIX Corporation (IX) Calculator?
- All-in-One Solution: Features DCF, WACC, and financial ratio analyses seamlessly integrated.
- Flexible Inputs: Modify highlighted cells to explore different financial scenarios.
- In-Depth Analysis: Automatically computes ORIX Corporation’s intrinsic value and Net Present Value.
- Data-Rich Environment: Comes with historical and projected data for precise calculations.
- Expert-Level Tool: Perfect for financial analysts, investors, and business advisors.
Who Should Use This Product?
- Investors: Accurately assess ORIX Corporation’s (IX) fair value prior to making investment choices.
- CFOs: Utilize a high-quality DCF model for financial reporting and analysis related to ORIX Corporation (IX).
- Consultants: Easily customize the template for valuation reports tailored to ORIX Corporation (IX) clients.
- Entrepreneurs: Acquire knowledge about financial modeling practices employed by leading corporations like ORIX Corporation (IX).
- Educators: Implement it as a pedagogical resource to illustrate valuation techniques relevant to ORIX Corporation (IX).
What the Template Contains
- Historical Data: Includes ORIX Corporation's past financials and baseline forecasts.
- DCF and Levered DCF Models: Detailed templates to calculate ORIX Corporation's intrinsic value.
- WACC Sheet: Pre-built calculations for Weighted Average Cost of Capital.
- Editable Inputs: Modify key drivers like growth rates, EBITDA %, and CAPEX assumptions.
- Quarterly and Annual Statements: A complete breakdown of ORIX Corporation's financials.
- Interactive Dashboard: Visualize valuation results and projections dynamically.
Disclaimer
All information, articles, and product details provided on this website are for general informational and educational purposes only. We do not claim any ownership over, nor do we intend to infringe upon, any trademarks, copyrights, logos, brand names, or other intellectual property mentioned or depicted on this site. Such intellectual property remains the property of its respective owners, and any references here are made solely for identification or informational purposes, without implying any affiliation, endorsement, or partnership.
We make no representations or warranties, express or implied, regarding the accuracy, completeness, or suitability of any content or products presented. Nothing on this website should be construed as legal, tax, investment, financial, medical, or other professional advice. In addition, no part of this site—including articles or product references—constitutes a solicitation, recommendation, endorsement, advertisement, or offer to buy or sell any securities, franchises, or other financial instruments, particularly in jurisdictions where such activity would be unlawful.
All content is of a general nature and may not address the specific circumstances of any individual or entity. It is not a substitute for professional advice or services. Any actions you take based on the information provided here are strictly at your own risk. You accept full responsibility for any decisions or outcomes arising from your use of this website and agree to release us from any liability in connection with your use of, or reliance upon, the content or products found herein.