
|
JAMF Holding Corp. (JAMF) DCF -Bewertung |
Fully Editable: Tailor To Your Needs In Excel Or Sheets
Professional Design: Trusted, Industry-Standard Templates
Investor-Approved Valuation Models
MAC/PC Compatible, Fully Unlocked
No Expertise Is Needed; Easy To Follow
Jamf Holding Corp. (JAMF) Bundle
Unser DCF-Taschenrechner von JAMF Holding Corp. (JAMF) für Genauigkeit ermöglicht es Ihnen, die Bewertung von JAMF mithilfe realer Finanzinformationen zu bewerten und gleichzeitig eine vollständige Flexibilität zu ermöglichen, um alle wesentlichen Parameter für erweiterte Projektionen zu ändern.
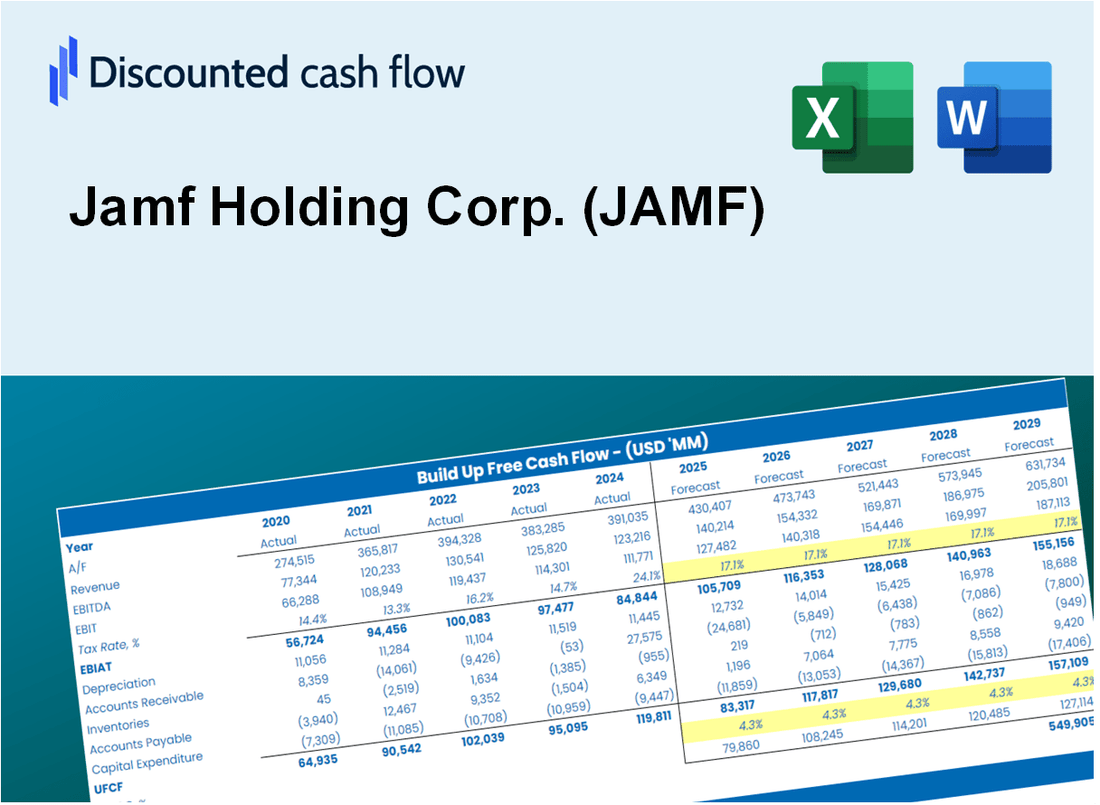
Discounted Cash Flow (DCF) - (USD MM)
| Year | AY1 2020 |
AY2 2021 |
AY3 2022 |
AY4 2023 |
AY5 2024 |
FY1 2025 |
FY2 2026 |
FY3 2027 |
FY4 2028 |
FY5 2029 |
|---|---|---|---|---|---|---|---|---|---|---|
| Revenue | 269.1 | 366.4 | 478.8 | 560.6 | 627.4 | 777.7 | 964.0 | 1,194.9 | 1,481.1 | 1,835.9 |
| Revenue Growth, % | 0 | 36.14 | 30.67 | 17.08 | 11.92 | 23.95 | 23.95 | 23.95 | 23.95 | 23.95 |
| EBITDA | 15.2 | -11.7 | -78.7 | -54.6 | -22.1 | -42.4 | -52.5 | -65.1 | -80.7 | -100.0 |
| EBITDA, % | 5.65 | -3.2 | -16.44 | -9.73 | -3.53 | -5.45 | -5.45 | -5.45 | -5.45 | -5.45 |
| Depreciation | 38.5 | 47.1 | 54.8 | 50.3 | 46.9 | 85.6 | 106.2 | 131.6 | 163.1 | 202.2 |
| Depreciation, % | 14.31 | 12.85 | 11.45 | 8.97 | 7.48 | 11.01 | 11.01 | 11.01 | 11.01 | 11.01 |
| EBIT | -23.3 | -58.8 | -133.5 | -104.9 | -69.1 | -128.0 | -158.7 | -196.7 | -243.8 | -302.2 |
| EBIT, % | -8.66 | -16.04 | -27.89 | -18.71 | -11.01 | -16.46 | -16.46 | -16.46 | -16.46 | -16.46 |
| Total Cash | 194.9 | 177.2 | 224.3 | 247.2 | 224.7 | 385.0 | 477.2 | 591.5 | 733.2 | 908.9 |
| Total Cash, percent | .0 | .0 | .0 | .0 | .0 | .0 | .0 | .0 | .0 | .0 |
| Account Receivables | 69.7 | 79.8 | 88.2 | 108.2 | 138.8 | 167.2 | 207.3 | 256.9 | 318.5 | 394.7 |
| Account Receivables, % | 25.89 | 21.77 | 18.41 | 19.31 | 22.12 | 21.5 | 21.5 | 21.5 | 21.5 | 21.5 |
| Inventories | .0 | 30.5 | 32.0 | .0 | .0 | 23.3 | 28.9 | 35.8 | 44.4 | 55.1 |
| Inventories, % | 0 | 8.32 | 6.68 | 0 | 0 | 3 | 3 | 3 | 3 | 3 |
| Accounts Payable | 7.0 | 9.3 | 15.4 | 25.9 | 18.4 | 24.7 | 30.7 | 38.0 | 47.1 | 58.4 |
| Accounts Payable, % | 2.59 | 2.54 | 3.22 | 4.62 | 2.93 | 3.18 | 3.18 | 3.18 | 3.18 | 3.18 |
| Capital Expenditure | -4.4 | -9.8 | -7.7 | -2.9 | -9.0 | -12.2 | -15.2 | -18.8 | -23.3 | -28.9 |
| Capital Expenditure, % | -1.62 | -2.66 | -1.61 | -0.52339 | -1.44 | -1.57 | -1.57 | -1.57 | -1.57 | -1.57 |
| Tax Rate, % | -5.71 | -5.71 | -5.71 | -5.71 | -5.71 | -5.71 | -5.71 | -5.71 | -5.71 | -5.71 |
| EBITAT | -16.5 | -55.3 | -132.7 | -107.1 | -73.0 | -118.8 | -147.3 | -182.6 | -226.3 | -280.5 |
| Depreciation | ||||||||||
| Changes in Account Receivables | ||||||||||
| Changes in Inventories | ||||||||||
| Changes in Accounts Payable | ||||||||||
| Capital Expenditure | ||||||||||
| UFCF | -45.1 | -56.2 | -89.4 | -37.3 | -73.2 | -90.8 | -96.0 | -119.0 | -147.5 | -182.9 |
| WACC, % | 5.34 | 5.5 | 5.53 | 5.54 | 5.54 | 5.49 | 5.49 | 5.49 | 5.49 | 5.49 |
| PV UFCF | ||||||||||
| SUM PV UFCF | -532.9 | |||||||||
| Long Term Growth Rate, % | 2.00 | |||||||||
| Free cash flow (T + 1) | -187 | |||||||||
| Terminal Value | -5,349 | |||||||||
| Present Terminal Value | -4,095 | |||||||||
| Enterprise Value | -4,628 | |||||||||
| Net Debt | 145 | |||||||||
| Equity Value | -4,773 | |||||||||
| Diluted Shares Outstanding, MM | 128 | |||||||||
| Equity Value Per Share | -37.28 |
What You Will Get
- Editable Excel Template: A fully customizable Excel-based DCF Calculator featuring pre-filled real JAMF financials.
- Real-World Data: Historical data and forward-looking estimates (as indicated in the yellow cells).
- Forecast Flexibility: Adjust forecast assumptions such as revenue growth, EBITDA %, and WACC.
- Automatic Calculations: Instantly observe the effects of your inputs on Jamf's valuation.
- Professional Tool: Designed for investors, CFOs, consultants, and financial analysts.
- User-Friendly Design: Organized for clarity and ease of use, complete with step-by-step instructions.
Key Features
- Customizable Financial Inputs: Adjust essential variables such as subscription growth, operating margins, and R&D expenditures.
- Instant DCF Valuation: Quickly computes intrinsic value, NPV, and various financial metrics.
- High Precision Accuracy: Leverages Jamf’s actual financial data for dependable valuation results.
- Streamlined Scenario Analysis: Easily evaluate different scenarios and assess their impacts.
- Efficiency Booster: Avoid the hassle of creating intricate valuation models from the ground up.
How It Works
- Step 1: Download the Excel file.
- Step 2: Review Jamf Holding Corp.'s pre-filled financial data and forecasts.
- Step 3: Modify key inputs such as revenue growth, WACC, and tax rates (highlighted cells).
- Step 4: Observe the DCF model update in real-time as you adjust your assumptions.
- Step 5: Analyze the results and utilize the outputs for your investment decisions.
Why Choose This Calculator for Jamf Holding Corp. (JAMF)?
- Accurate Data: Utilize real Jamf financials for trustworthy valuation outcomes.
- Customizable: Modify essential parameters such as growth rates, WACC, and tax rates to align with your forecasts.
- Time-Saving: Pre-configured calculations save you the hassle of starting from scratch.
- Professional-Grade Tool: Tailored for investors, analysts, and consultants in the tech industry.
- User-Friendly: Easy-to-navigate design and clear instructions cater to users of all experience levels.
Who Should Use This Product?
- IT Professionals: Enhance your skills in managing Apple devices in enterprise environments.
- Educators: Integrate Jamf solutions into your curriculum to teach device management techniques.
- System Administrators: Optimize your workflow with Jamf's powerful management tools for Apple products.
- Business Leaders: Understand how to leverage device management for increased productivity and security.
- Small Business Owners: Discover how to efficiently manage Apple devices in your organization with Jamf's solutions.
What the Template Contains
- Comprehensive DCF Model: Editable template featuring in-depth valuation calculations.
- Real-World Data: Jamf Holding Corp.’s (JAMF) historical and projected financials preloaded for analysis.
- Customizable Parameters: Modify WACC, growth rates, and tax assumptions to evaluate different scenarios.
- Financial Statements: Complete annual and quarterly breakdowns for enhanced insights.
- Key Ratios: Integrated analysis for profitability, efficiency, and leverage metrics.
- Dashboard with Visual Outputs: Charts and tables providing clear, actionable results.
Disclaimer
All information, articles, and product details provided on this website are for general informational and educational purposes only. We do not claim any ownership over, nor do we intend to infringe upon, any trademarks, copyrights, logos, brand names, or other intellectual property mentioned or depicted on this site. Such intellectual property remains the property of its respective owners, and any references here are made solely for identification or informational purposes, without implying any affiliation, endorsement, or partnership.
We make no representations or warranties, express or implied, regarding the accuracy, completeness, or suitability of any content or products presented. Nothing on this website should be construed as legal, tax, investment, financial, medical, or other professional advice. In addition, no part of this site—including articles or product references—constitutes a solicitation, recommendation, endorsement, advertisement, or offer to buy or sell any securities, franchises, or other financial instruments, particularly in jurisdictions where such activity would be unlawful.
All content is of a general nature and may not address the specific circumstances of any individual or entity. It is not a substitute for professional advice or services. Any actions you take based on the information provided here are strictly at your own risk. You accept full responsibility for any decisions or outcomes arising from your use of this website and agree to release us from any liability in connection with your use of, or reliance upon, the content or products found herein.