
|
Janux Therapeutics, Inc. (Janx) DCF -Bewertung |
Fully Editable: Tailor To Your Needs In Excel Or Sheets
Professional Design: Trusted, Industry-Standard Templates
Investor-Approved Valuation Models
MAC/PC Compatible, Fully Unlocked
No Expertise Is Needed; Easy To Follow
Janux Therapeutics, Inc. (JANX) Bundle
Unser (Janx) DCF-Taschenrechner entwickelt für die Genauigkeit und ermöglicht es Ihnen, die Bewertung von Janux Therapeutics, Inc. mithilfe realer Finanzdaten zu bewerten und vollständige Flexibilität zu bieten, um alle wesentlichen Parameter für erweiterte Projektionen zu ändern.
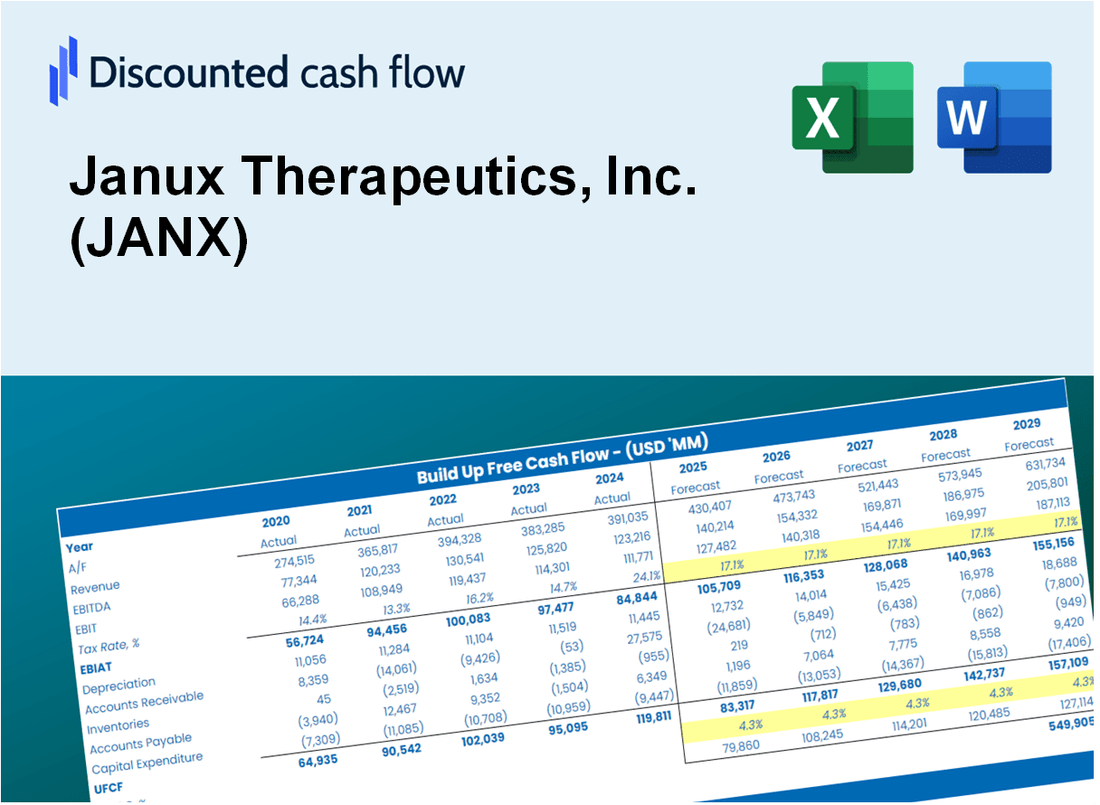
Discounted Cash Flow (DCF) - (USD MM)
| Year | AY1 2020 |
AY2 2021 |
AY3 2022 |
AY4 2023 |
AY5 2024 |
FY1 2025 |
FY2 2026 |
FY3 2027 |
FY4 2028 |
FY5 2029 |
|---|---|---|---|---|---|---|---|---|---|---|
| Revenue | .0 | 3.6 | 8.6 | 8.1 | 10.6 | 13.9 | 18.2 | 23.9 | 31.4 | 41.2 |
| Revenue Growth, % | 0 | 0 | 136.79 | -6.14 | 30.99 | 31.21 | 31.21 | 31.21 | 31.21 | 31.21 |
| EBITDA | -6.6 | -32.8 | -66.3 | -71.0 | -96.8 | -8.3 | -10.9 | -14.4 | -18.8 | -24.7 |
| EBITDA, % | 100 | -902.28 | -769.28 | -878.68 | -914.12 | -60 | -60 | -60 | -60 | -60 |
| Depreciation | .0 | .1 | .8 | 2.0 | 2.1 | 4.3 | 5.7 | 7.5 | 9.8 | 12.9 |
| Depreciation, % | 100 | 3.11 | 9.77 | 24.19 | 19.46 | 31.3 | 31.3 | 31.3 | 31.3 | 31.3 |
| EBIT | -6.6 | -32.9 | -67.1 | -73.0 | -98.8 | -8.3 | -10.9 | -14.4 | -18.8 | -24.7 |
| EBIT, % | 100 | -905.39 | -779.04 | -902.87 | -933.58 | -60 | -60 | -60 | -60 | -60 |
| Total Cash | 7.8 | 375.0 | 327.0 | 344.0 | 1,025.2 | 13.9 | 18.2 | 23.9 | 31.4 | 41.2 |
| Total Cash, percent | .0 | .0 | .0 | .0 | .0 | .0 | .0 | .0 | .0 | .0 |
| Account Receivables | 8.0 | .0 | .7 | .0 | 5.4 | 4.4 | 5.8 | 7.6 | 10.0 | 13.1 |
| Account Receivables, % | 100 | 0 | 8.13 | 0 | 50.82 | 31.79 | 31.79 | 31.79 | 31.79 | 31.79 |
| Inventories | .0 | .0 | -.7 | .0 | .0 | 2.6 | 3.3 | 4.4 | 5.8 | 7.6 |
| Inventories, % | 100 | 0 | -8.13 | 0 | 0 | 18.37 | 18.37 | 18.37 | 18.37 | 18.37 |
| Accounts Payable | .4 | 2.5 | 2.2 | 2.4 | 4.0 | 7.2 | 9.5 | 12.5 | 16.4 | 21.5 |
| Accounts Payable, % | 100 | 67.58 | 25.07 | 29.99 | 38.02 | 52.13 | 52.13 | 52.13 | 52.13 | 52.13 |
| Capital Expenditure | .0 | -1.5 | -6.4 | -1.9 | -.4 | -3.9 | -5.2 | -6.8 | -8.9 | -11.7 |
| Capital Expenditure, % | 100 | -40.75 | -74.84 | -22.89 | -3.39 | -28.37 | -28.37 | -28.37 | -28.37 | -28.37 |
| Tax Rate, % | 0 | 0 | 0 | 0 | 0 | 0 | 0 | 0 | 0 | 0 |
| EBITAT | -6.6 | -32.9 | -67.1 | -73.0 | -98.8 | -8.3 | -10.9 | -14.4 | -18.8 | -24.7 |
| Depreciation | ||||||||||
| Changes in Account Receivables | ||||||||||
| Changes in Inventories | ||||||||||
| Changes in Accounts Payable | ||||||||||
| Capital Expenditure | ||||||||||
| UFCF | -14.1 | -24.3 | -73.0 | -72.6 | -100.9 | -6.3 | -10.3 | -13.5 | -17.8 | -23.3 |
| WACC, % | 16.88 | 16.88 | 16.88 | 16.88 | 16.88 | 16.88 | 16.88 | 16.88 | 16.88 | 16.88 |
| PV UFCF | ||||||||||
| SUM PV UFCF | -41.6 | |||||||||
| Long Term Growth Rate, % | 2.00 | |||||||||
| Free cash flow (T + 1) | -24 | |||||||||
| Terminal Value | -160 | |||||||||
| Present Terminal Value | -73 | |||||||||
| Enterprise Value | -115 | |||||||||
| Net Debt | -408 | |||||||||
| Equity Value | 293 | |||||||||
| Diluted Shares Outstanding, MM | 54 | |||||||||
| Equity Value Per Share | 5.45 |
What You Will Get
- Real JANX Financial Data: Pre-filled with Janux Therapeutics' historical and projected data for precise analysis.
- Fully Editable Template: Easily modify key inputs such as revenue growth, WACC, and EBITDA %.
- Automatic Calculations: Instantly see Janux Therapeutics' intrinsic value update based on your adjustments.
- Professional Valuation Tool: Tailored for investors, analysts, and consultants aiming for accurate DCF results.
- User-Friendly Design: Intuitive structure and clear instructions suitable for all experience levels.
Key Features
- Innovative Drug Development Pipeline: Focus on unique therapeutic approaches for cancer treatment.
- Robust Clinical Trial Management: Comprehensive tracking and analysis of ongoing clinical studies.
- Customizable Financial Projections: Adjust revenue forecasts, R&D expenses, and market penetration rates.
- Integrated Market Analysis: Evaluate competitive landscape and market opportunities for [JANX].
- Dynamic Reporting Tools: Visual dashboards present key performance indicators for informed decision-making.
How It Works
- Download: Obtain the pre-configured Excel file containing Janux Therapeutics, Inc.'s (JANX) financial data.
- Customize: Modify projections, such as revenue growth, EBITDA %, and WACC as per your analysis.
- Update Automatically: The intrinsic value and NPV calculations refresh in real-time for accurate insights.
- Test Scenarios: Generate various forecasts and instantly compare the results.
- Make Decisions: Leverage the valuation findings to inform your investment choices.
Why Choose This Calculator for Janux Therapeutics, Inc. (JANX)?
- Accurate Data: Utilize real Janux financials for dependable valuation outcomes.
- Customizable: Tailor essential parameters such as growth rates, WACC, and tax rates to align with your forecasts.
- Time-Saving: Pre-configured calculations save you from building from the ground up.
- Professional-Grade Tool: Crafted for investors, analysts, and consultants in the biotech sector.
- User-Friendly: Easy-to-navigate design and guided instructions cater to users of all experience levels.
Who Should Use Janux Therapeutics, Inc. (JANX)?
- Investors: Gain insights into innovative cancer therapies with our cutting-edge research and development data.
- Healthcare Analysts: Streamline your analysis with comprehensive reports on our pipeline and market potential.
- Consultants: Easily tailor presentations or reports using our detailed product information and market strategies.
- Biotech Enthusiasts: Enhance your knowledge of breakthrough therapies and their impact on patient care.
- Educators and Students: Utilize our resources as a practical case study in biotechnology and pharmaceutical courses.
What the Template Contains
- Operating and Balance Sheet Data: Pre-filled Janux Therapeutics historical data and forecasts, including revenue, EBITDA, EBIT, and capital expenditures.
- WACC Calculation: A dedicated sheet for Weighted Average Cost of Capital (WACC), including parameters like Beta, risk-free rate, and share price.
- DCF Valuation (Unlevered and Levered): Editable Discounted Cash Flow models showing intrinsic value with detailed calculations.
- Financial Statements: Pre-loaded financial statements (annual and quarterly) to support analysis.
- Key Ratios: Includes profitability, leverage, and efficiency ratios for Janux Therapeutics, Inc. (JANX).
- Dashboard and Charts: Visual summary of valuation outputs and assumptions to analyze results easily.
Disclaimer
All information, articles, and product details provided on this website are for general informational and educational purposes only. We do not claim any ownership over, nor do we intend to infringe upon, any trademarks, copyrights, logos, brand names, or other intellectual property mentioned or depicted on this site. Such intellectual property remains the property of its respective owners, and any references here are made solely for identification or informational purposes, without implying any affiliation, endorsement, or partnership.
We make no representations or warranties, express or implied, regarding the accuracy, completeness, or suitability of any content or products presented. Nothing on this website should be construed as legal, tax, investment, financial, medical, or other professional advice. In addition, no part of this site—including articles or product references—constitutes a solicitation, recommendation, endorsement, advertisement, or offer to buy or sell any securities, franchises, or other financial instruments, particularly in jurisdictions where such activity would be unlawful.
All content is of a general nature and may not address the specific circumstances of any individual or entity. It is not a substitute for professional advice or services. Any actions you take based on the information provided here are strictly at your own risk. You accept full responsibility for any decisions or outcomes arising from your use of this website and agree to release us from any liability in connection with your use of, or reliance upon, the content or products found herein.