
|
J.B. Hunt Transport Services, Inc. (JBHT) DCF -Bewertung |
Fully Editable: Tailor To Your Needs In Excel Or Sheets
Professional Design: Trusted, Industry-Standard Templates
Investor-Approved Valuation Models
MAC/PC Compatible, Fully Unlocked
No Expertise Is Needed; Easy To Follow
J.B. Hunt Transport Services, Inc. (JBHT) Bundle
Stürzen Sie Ihre Analyse und steigern Sie die Präzision mit unserem (JBHT) DCF -Taschenrechner! Mit realen Daten von J.B. Hunt Transport Services, Inc. und anpassbaren Annahmen ermöglicht dieses Tool, wie ein erfahrener Investor prognostiziert, bewerten und value (JBHT).
What You Will Get
- Editable Excel Template: A fully customizable Excel-based DCF Calculator featuring pre-filled real JBHT financials.
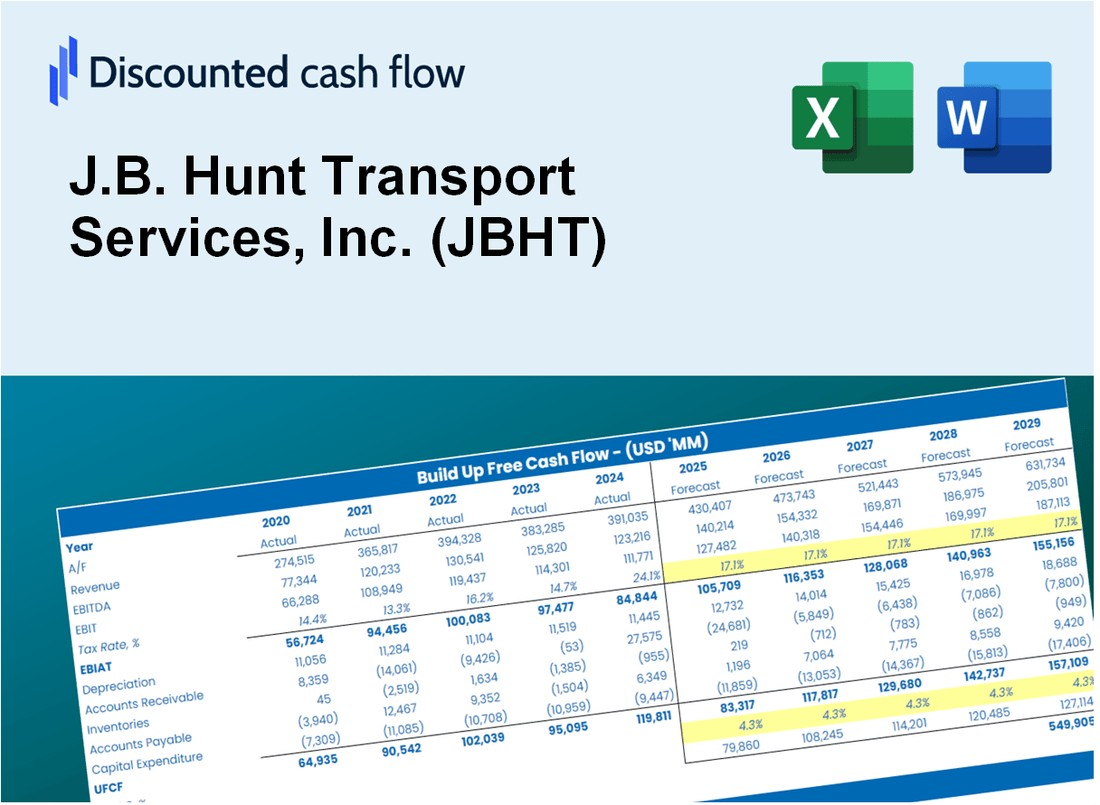
- Real-World Data: Historical data and forward-looking estimates (as shown in the yellow cells).
- Forecast Flexibility: Adjust forecast assumptions such as revenue growth, EBITDA %, and WACC.
- Automatic Calculations: Instantly view the effects of your inputs on J.B. Hunt’s valuation.
- Professional Tool: Designed for investors, CFOs, consultants, and financial analysts.
- User-Friendly Design: Organized for clarity and ease of use, with comprehensive step-by-step instructions.
Key Features
- Pre-Loaded Data: J.B. Hunt's historical financial statements and pre-filled forecasts.
- Fully Adjustable Inputs: Modify WACC, tax rates, revenue growth, and EBITDA margins.
- Instant Results: View J.B. Hunt's intrinsic value recalculated in real time.
- Clear Visual Outputs: Dashboard charts showcase valuation results and key metrics.
- Built for Accuracy: A professional tool designed for analysts, investors, and finance experts.
How It Works
- Download: Obtain the comprehensive Excel file containing J.B. Hunt's financial data.
- Customize: Modify forecasts such as revenue growth, EBITDA %, and WACC to suit your analysis.
- Update Automatically: Watch as intrinsic value and NPV calculations refresh in real-time.
- Test Scenarios: Generate various projections and evaluate outcomes instantly.
- Make Decisions: Leverage the valuation results to inform your investment strategy for J.B. Hunt Transport Services, Inc. (JBHT).
Why Choose This Calculator for J.B. Hunt Transport Services, Inc. (JBHT)?
- All-in-One Solution: Combines DCF, WACC, and key financial ratios for comprehensive analysis.
- Flexible Inputs: Modify the yellow-highlighted fields to explore different financial scenarios.
- In-Depth Analysis: Automatically computes J.B. Hunt's intrinsic value and Net Present Value.
- Ready-to-Use Data: Historical and projected data provide reliable foundations for analysis.
- High-Quality Standards: Perfect for financial analysts, investors, and business advisors.
Who Should Use This Product?
- Logistics Professionals: Develop comprehensive and accurate models for transportation and logistics analysis.
- Corporate Finance Teams: Evaluate valuation scenarios to inform strategic decisions within the company.
- Consultants and Advisors: Deliver precise valuation insights for J.B. Hunt Transport Services, Inc. (JBHT) to clients.
- Students and Educators: Utilize real-world data to learn and teach about financial modeling in the transportation sector.
- Industry Analysts: Gain insights into how transportation companies like J.B. Hunt are valued in the market.
What the Template Contains
- Preloaded JBHT Data: Historical and projected financial data, including revenue, EBIT, and capital expenditures.
- DCF and WACC Models: Professional-grade sheets for calculating intrinsic value and Weighted Average Cost of Capital.
- Editable Inputs: Yellow-highlighted cells for adjusting revenue growth, tax rates, and discount rates.
- Financial Statements: Comprehensive annual and quarterly financials for deeper analysis.
- Key Ratios: Profitability, leverage, and efficiency ratios to evaluate performance.
- Dashboard and Charts: Visual summaries of valuation outcomes and assumptions.
Disclaimer
All information, articles, and product details provided on this website are for general informational and educational purposes only. We do not claim any ownership over, nor do we intend to infringe upon, any trademarks, copyrights, logos, brand names, or other intellectual property mentioned or depicted on this site. Such intellectual property remains the property of its respective owners, and any references here are made solely for identification or informational purposes, without implying any affiliation, endorsement, or partnership.
We make no representations or warranties, express or implied, regarding the accuracy, completeness, or suitability of any content or products presented. Nothing on this website should be construed as legal, tax, investment, financial, medical, or other professional advice. In addition, no part of this site—including articles or product references—constitutes a solicitation, recommendation, endorsement, advertisement, or offer to buy or sell any securities, franchises, or other financial instruments, particularly in jurisdictions where such activity would be unlawful.
All content is of a general nature and may not address the specific circumstances of any individual or entity. It is not a substitute for professional advice or services. Any actions you take based on the information provided here are strictly at your own risk. You accept full responsibility for any decisions or outcomes arising from your use of this website and agree to release us from any liability in connection with your use of, or reliance upon, the content or products found herein.