
|
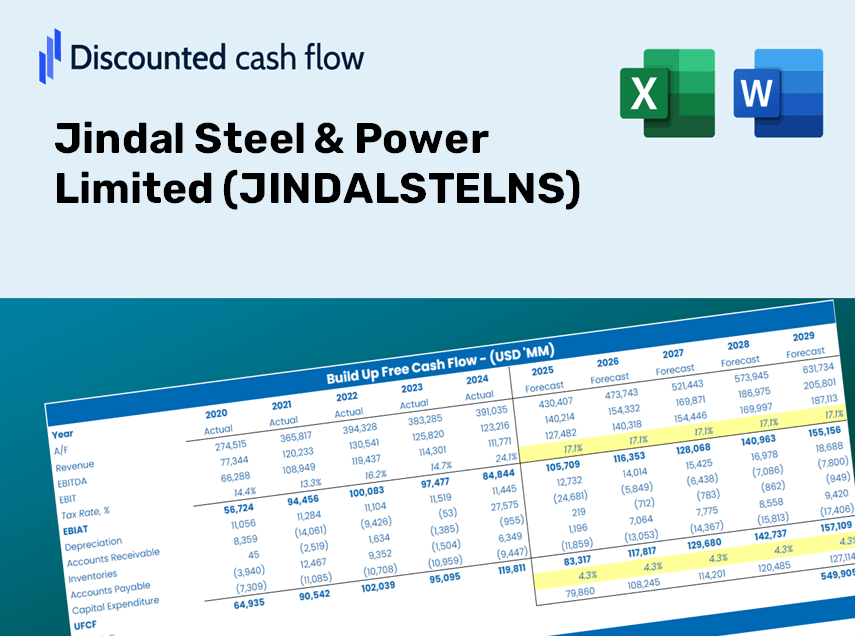
Jindal Stahl & Power Limited (Jindalstel.NS) DCF -Bewertung |
Fully Editable: Tailor To Your Needs In Excel Or Sheets
Professional Design: Trusted, Industry-Standard Templates
Investor-Approved Valuation Models
MAC/PC Compatible, Fully Unlocked
No Expertise Is Needed; Easy To Follow
Jindal Steel & Power Limited (JINDALSTEL.NS) Bundle
Unabhängig davon, ob Sie ein Investor oder ein Analyst sind, ist dieser (Jindalstelns) DCF-Taschenrechner Ihre Anlaufstelle für eine genaue Bewertung. Mit echten Daten von Jindal Steel ausgeladen & Power Limited können Sie Prognosen anpassen und die Effekte in Echtzeit betrachten.
Discounted Cash Flow (DCF) - (USD MM)
| Year | AY1 2021 |
AY2 2022 |
AY3 2023 |
AY4 2024 |
AY5 2025 |
FY1 2026 |
FY2 2027 |
FY3 2028 |
FY4 2029 |
FY5 2030 |
|---|---|---|---|---|---|---|---|---|---|---|
| Revenue | 345,405.4 | 510,855.6 | 527,111.8 | 500,267.6 | 497,649.7 | 554,215.6 | 617,211.2 | 687,367.2 | 765,497.5 | 852,508.6 |
| Revenue Growth, % | 0 | 47.9 | 3.18 | -5.09 | -0.5233 | 11.37 | 11.37 | 11.37 | 11.37 | 11.37 |
| EBITDA | 143,491.7 | 171,468.1 | 97,267.2 | 100,964.9 | 81,820.7 | 144,300.4 | 160,702.4 | 178,968.9 | 199,311.6 | 221,966.5 |
| EBITDA, % | 41.54 | 33.56 | 18.45 | 20.18 | 16.44 | 26.04 | 26.04 | 26.04 | 26.04 | 26.04 |
| Depreciation | 37,606.0 | 38,750.4 | 26,252.3 | 27,627.2 | 27,368.7 | 38,213.6 | 42,557.2 | 47,394.5 | 52,781.6 | 58,781.1 |
| Depreciation, % | 10.89 | 7.59 | 4.98 | 5.52 | 5.5 | 6.9 | 6.9 | 6.9 | 6.9 | 6.9 |
| EBIT | 105,885.7 | 132,717.7 | 71,014.9 | 73,337.7 | 54,452.0 | 106,086.8 | 118,145.3 | 131,574.4 | 146,529.9 | 163,185.4 |
| EBIT, % | 30.66 | 25.98 | 13.47 | 14.66 | 10.94 | 19.14 | 19.14 | 19.14 | 19.14 | 19.14 |
| Total Cash | 69,766.5 | 38,708.2 | 51,668.9 | 44,595.6 | 58,853.1 | 64,641.9 | 71,989.5 | 80,172.3 | 89,285.2 | 99,433.9 |
| Total Cash, percent | .0 | .0 | .0 | .0 | .0 | .0 | .0 | .0 | .0 | .0 |
| Account Receivables | 30,333.6 | 15,220.4 | 12,698.1 | 16,645.4 | 13,957.0 | 22,503.7 | 25,061.6 | 27,910.3 | 31,082.7 | 34,615.8 |
| Account Receivables, % | 8.78 | 2.98 | 2.41 | 3.33 | 2.8 | 4.06 | 4.06 | 4.06 | 4.06 | 4.06 |
| Inventories | 59,425.7 | 72,813.6 | 58,867.8 | 70,773.7 | 56,102.2 | 75,424.8 | 83,998.1 | 93,545.8 | 104,178.8 | 116,020.4 |
| Inventories, % | 17.2 | 14.25 | 11.17 | 14.15 | 11.27 | 13.61 | 13.61 | 13.61 | 13.61 | 13.61 |
| Accounts Payable | 40,382.9 | 52,519.4 | 47,004.4 | 46,815.4 | 57,125.1 | 57,335.3 | 63,852.4 | 71,110.2 | 79,193.0 | 88,194.6 |
| Accounts Payable, % | 11.69 | 10.28 | 8.92 | 9.36 | 11.48 | 10.35 | 10.35 | 10.35 | 10.35 | 10.35 |
| Capital Expenditure | -8,581.1 | -29,444.5 | -64,484.8 | -85,170.9 | -106,070.9 | -65,199.2 | -72,610.2 | -80,863.5 | -90,054.9 | -100,291.1 |
| Capital Expenditure, % | -2.48 | -5.76 | -12.23 | -17.03 | -21.31 | -11.76 | -11.76 | -11.76 | -11.76 | -11.76 |
| Tax Rate, % | 35.26 | 35.26 | 35.26 | 35.26 | 35.26 | 35.26 | 35.26 | 35.26 | 35.26 | 35.26 |
| EBITAT | 46,624.8 | 68,338.2 | 50,250.3 | 69,779.1 | 35,253.7 | 69,205.7 | 77,072.1 | 85,832.5 | 95,588.8 | 106,454.0 |
| Depreciation | ||||||||||
| Changes in Account Receivables | ||||||||||
| Changes in Inventories | ||||||||||
| Changes in Accounts Payable | ||||||||||
| Capital Expenditure | ||||||||||
| UFCF | 26,273.3 | 91,505.9 | 22,970.9 | -3,806.8 | -15,778.9 | 14,560.9 | 42,405.0 | 47,225.0 | 52,592.9 | 58,570.9 |
| WACC, % | 6.27 | 6.36 | 6.59 | 6.88 | 6.52 | 6.52 | 6.52 | 6.52 | 6.52 | 6.52 |
| PV UFCF | ||||||||||
| SUM PV UFCF | 173,652.6 | |||||||||
| Long Term Growth Rate, % | 3.50 | |||||||||
| Free cash flow (T + 1) | 60,621 | |||||||||
| Terminal Value | 2,004,461 | |||||||||
| Present Terminal Value | 1,461,349 | |||||||||
| Enterprise Value | 1,635,002 | |||||||||
| Net Debt | 157,891 | |||||||||
| Equity Value | 1,477,111 | |||||||||
| Diluted Shares Outstanding, MM | 1,011 | |||||||||
| Equity Value Per Share | 1,461.60 |
What You Will Receive
- Authentic JINDALSTELNS Financial Data: Pre-populated with Jindal Steel & Power Limited's historical and projected figures for accurate analysis.
- Completely Customizable Template: Easily adjust key variables such as revenue growth, WACC, and EBITDA percentage.
- Instant Calculations: Witness the real-time update of Jindal Steel's intrinsic value as you modify inputs.
- Professional Valuation Tool: Crafted for investors, analysts, and consultants who require reliable DCF outcomes.
- Intuitive Design: Structured for simplicity with clear guidance suitable for users of all skill levels.
Key Features
- Customizable Forecast Variables: Adjust essential metrics such as revenue growth, EBITDA %, and capital investments.
- Instant DCF Valuation: Quickly computes intrinsic value, NPV, and additional key outputs.
- Precision-Driven Accuracy: Leverages Jindal Steel & Power Limited's (JINDALSTELNS) real financial data for credible valuation results.
- Effortless Scenario Analysis: Easily explore various assumptions and evaluate different outcomes.
- Efficiency Booster: Remove the requirement to create intricate valuation models from the beginning.
How It Operates
- 1. Access the Template: Download and open the Excel file containing Jindal Steel & Power Limited’s preloaded financial data.
- 2. Modify Assumptions: Adjust key inputs such as growth rates, WACC, and capital expenditures according to your analysis.
- 3. View Results in Real-Time: The DCF model automatically computes intrinsic value and NPV based on your inputs.
- 4. Explore Scenarios: Evaluate various forecasts to examine different valuation possibilities.
- 5. Utilize with Assurance: Present refined valuation insights to reinforce your strategic decisions.
Why Choose This Calculator for Jindal Steel & Power Limited (JINDALSTELNS)?
- Designed for Experts: A sophisticated tool favored by industry analysts, financial officers, and consultants.
- Accurate Data: Historical and forecasted financial data for Jindal Steel preloaded for precision.
- Flexible Scenario Analysis: Effortlessly test various forecasts and assumptions.
- Comprehensive Outputs: Instantly computes intrinsic value, NPV, and essential financial metrics.
- User-Friendly Experience: Detailed, step-by-step guidance ensures an intuitive process.
Who Can Benefit from Jindal Steel & Power Limited (JINDALSTELNS)?
- Investors: Make informed investment choices with insights from a leading steel and power company.
- Financial Analysts: Streamline your analysis with comprehensive data and reports on JINDALSTELNS.
- Consultants: Tailor presentations and reports with up-to-date information on Jindal Steel’s performance.
- Industry Enthusiasts: Enhance your knowledge of the steel and power sectors through case studies and market trends.
- Educators and Students: Utilize JINDALSTELNS as a case study for learning about corporate finance and industry analysis.
Overview of the Template Features
- Pre-Filled DCF Model: Financial data for Jindal Steel & Power Limited (JINDALSTELNS) preloaded for immediate application.
- WACC Calculator: Comprehensive calculations for the Weighted Average Cost of Capital.
- Financial Ratios: Assess Jindal Steel & Power's profitability, leverage, and operational efficiency.
- Editable Inputs: Modify assumptions such as growth rates, margins, and capital expenditures to align with your scenarios.
- Financial Statements: Access annual and quarterly reports to facilitate in-depth analysis.
- Interactive Dashboard: Effortlessly visualize crucial valuation metrics and outcomes.
Disclaimer
All information, articles, and product details provided on this website are for general informational and educational purposes only. We do not claim any ownership over, nor do we intend to infringe upon, any trademarks, copyrights, logos, brand names, or other intellectual property mentioned or depicted on this site. Such intellectual property remains the property of its respective owners, and any references here are made solely for identification or informational purposes, without implying any affiliation, endorsement, or partnership.
We make no representations or warranties, express or implied, regarding the accuracy, completeness, or suitability of any content or products presented. Nothing on this website should be construed as legal, tax, investment, financial, medical, or other professional advice. In addition, no part of this site—including articles or product references—constitutes a solicitation, recommendation, endorsement, advertisement, or offer to buy or sell any securities, franchises, or other financial instruments, particularly in jurisdictions where such activity would be unlawful.
All content is of a general nature and may not address the specific circumstances of any individual or entity. It is not a substitute for professional advice or services. Any actions you take based on the information provided here are strictly at your own risk. You accept full responsibility for any decisions or outcomes arising from your use of this website and agree to release us from any liability in connection with your use of, or reliance upon, the content or products found herein.