
|
Juniper Networks, Inc. (JNPR) DCF -Bewertung |
Fully Editable: Tailor To Your Needs In Excel Or Sheets
Professional Design: Trusted, Industry-Standard Templates
Investor-Approved Valuation Models
MAC/PC Compatible, Fully Unlocked
No Expertise Is Needed; Easy To Follow
Juniper Networks, Inc. (JNPR) Bundle
Möchten Sie den inneren Wert von Juniper Networks, Inc. berechnen? Unser JNPR DCF-Taschenrechner integriert reale Daten mit umfassenden Anpassungsfunktionen, sodass Sie Prognosen anpassen und Ihre Investitionsauswahl verbessern können.
What You Will Get
- Real Juniper Data: Preloaded financials – from revenue to EBIT – based on actual and projected figures.
- Full Customization: Adjust all critical parameters (yellow cells) like WACC, growth %, and tax rates.
- Instant Valuation Updates: Automatic recalculations to analyze the impact of changes on Juniper's fair value.
- Versatile Excel Template: Tailored for quick edits, scenario testing, and detailed projections.
- Time-Saving and Accurate: Skip building models from scratch while maintaining precision and flexibility.
Key Features
- Customizable Network Metrics: Adjust essential parameters such as bandwidth usage, latency, and security protocols.
- Instant Network Performance Analysis: Provides real-time insights into network efficiency and performance metrics.
- Enterprise-Level Precision: Leverages Juniper's extensive data for accurate network assessments and predictions.
- Seamless Scenario Testing: Easily evaluate various network configurations and their potential impacts.
- Efficiency Booster: Streamlines the process of network design and optimization without starting from scratch.
How It Works
- Step 1: Download the prebuilt Excel template featuring Juniper Networks' data included.
- Step 2: Navigate through the pre-filled sheets to familiarize yourself with the essential metrics.
- Step 3: Modify forecasts and assumptions in the editable yellow cells (WACC, growth, margins).
- Step 4: Instantly see the recalculated results, including Juniper Networks' intrinsic value.
- Step 5: Make well-informed investment decisions or create reports based on the outputs.
Why Choose This Calculator for Juniper Networks, Inc. (JNPR)?
- Accurate Data: Authentic Juniper financials provide dependable valuation outcomes.
- Customizable: Modify essential parameters such as growth rates, WACC, and tax rates to align with your forecasts.
- Time-Saving: Pre-configured calculations save you from starting from the ground up.
- Professional-Grade Tool: Tailored for investors, analysts, and consultants in the tech sector.
- User-Friendly: Intuitive design and clear instructions make it accessible for all users.
Who Should Use Juniper Networks, Inc. (JNPR)?
- Network Engineers: Enhance your network design and management skills with cutting-edge solutions.
- IT Managers: Streamline operations using advanced tools for network performance monitoring.
- Cybersecurity Professionals: Leverage robust security features to protect your network infrastructure.
- Business Leaders: Make informed decisions on IT investments with comprehensive analytics.
- Students and Educators: Utilize resources for hands-on learning in networking and cybersecurity courses.
What the Template Contains
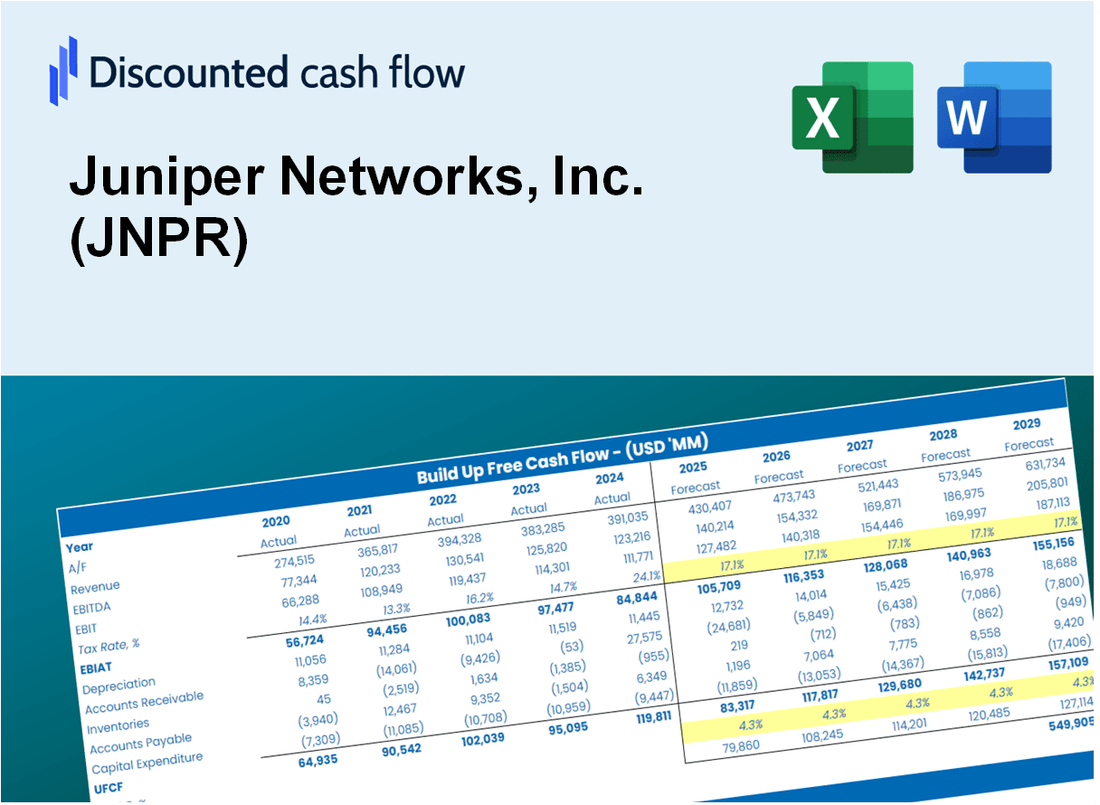
- Operating and Balance Sheet Data: Pre-filled Juniper Networks historical data and forecasts, including revenue, EBITDA, EBIT, and capital expenditures.
- WACC Calculation: A dedicated sheet for Weighted Average Cost of Capital (WACC), including parameters like Beta, risk-free rate, and share price.
- DCF Valuation (Unlevered and Levered): Editable Discounted Cash Flow models showing intrinsic value with detailed calculations.
- Financial Statements: Pre-loaded financial statements (annual and quarterly) to support analysis.
- Key Ratios: Includes profitability, leverage, and efficiency ratios for Juniper Networks, Inc. (JNPR).
- Dashboard and Charts: Visual summary of valuation outputs and assumptions to analyze results easily.
Disclaimer
All information, articles, and product details provided on this website are for general informational and educational purposes only. We do not claim any ownership over, nor do we intend to infringe upon, any trademarks, copyrights, logos, brand names, or other intellectual property mentioned or depicted on this site. Such intellectual property remains the property of its respective owners, and any references here are made solely for identification or informational purposes, without implying any affiliation, endorsement, or partnership.
We make no representations or warranties, express or implied, regarding the accuracy, completeness, or suitability of any content or products presented. Nothing on this website should be construed as legal, tax, investment, financial, medical, or other professional advice. In addition, no part of this site—including articles or product references—constitutes a solicitation, recommendation, endorsement, advertisement, or offer to buy or sell any securities, franchises, or other financial instruments, particularly in jurisdictions where such activity would be unlawful.
All content is of a general nature and may not address the specific circumstances of any individual or entity. It is not a substitute for professional advice or services. Any actions you take based on the information provided here are strictly at your own risk. You accept full responsibility for any decisions or outcomes arising from your use of this website and agree to release us from any liability in connection with your use of, or reliance upon, the content or products found herein.