
|
Kalvista Pharmaceuticals, Inc. (Kalv) DCF -Bewertung |
Fully Editable: Tailor To Your Needs In Excel Or Sheets
Professional Design: Trusted, Industry-Standard Templates
Investor-Approved Valuation Models
MAC/PC Compatible, Fully Unlocked
No Expertise Is Needed; Easy To Follow
KalVista Pharmaceuticals, Inc. (KALV) Bundle
Vereinfachen Sie die Bewertung von Kalvista Pharmaceuticals, Inc. (Kalv) mit diesem anpassbaren DCF -Taschenrechner! Mit Real Kalvista Pharmaceuticals, Inc. (Kalv) Finanzdaten und einstellbaren Prognose -Inputs können Sie Szenarien testen und Kalvista Pharmaceuticals, Inc. (Kalv) faire Wert in Minuten aufdecken.
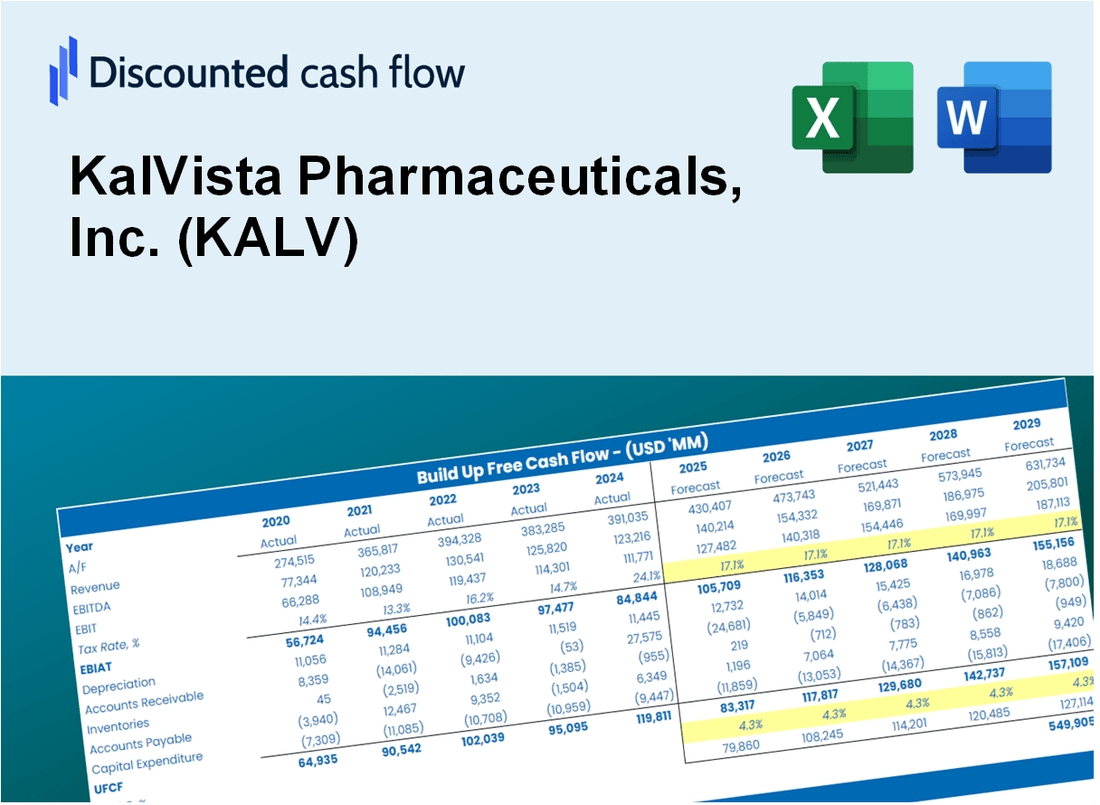
Discounted Cash Flow (DCF) - (USD MM)
| Year | AY1 2021 |
AY2 2022 |
AY3 2023 |
AY4 2024 |
AY5 2025 |
FY1 2026 |
FY2 2027 |
FY3 2028 |
FY4 2029 |
FY5 2030 |
|---|---|---|---|---|---|---|---|---|---|---|
| Revenue | 12.7 | .0 | .0 | .0 | .0 | .0 | .0 | .0 | .0 | .0 |
| Revenue Growth, % | 0 | -100 | 0 | 0 | 0 | -25 | -25 | -25 | -25 | -25 |
| EBITDA | -45.6 | -81.6 | -92.1 | -134.3 | -173.3 | .0 | .0 | .0 | .0 | .0 |
| EBITDA, % | -359.28 | 100 | 100 | 100 | 100 | 60 | 60 | 60 | 60 | 60 |
| Depreciation | .7 | .7 | .8 | .8 | .9 | .0 | .0 | .0 | .0 | .0 |
| Depreciation, % | 5.13 | 100 | 100 | 100 | 100 | 81.03 | 81.03 | 81.03 | 81.03 | 81.03 |
| EBIT | -46.2 | -82.3 | -92.9 | -135.1 | -174.3 | .0 | .0 | .0 | .0 | .0 |
| EBIT, % | -364.41 | 100 | 100 | 100 | 100 | 60 | 60 | 60 | 60 | 60 |
| Total Cash | 248.9 | 166.2 | 149.4 | 210.4 | 187.6 | .0 | .0 | .0 | .0 | .0 |
| Total Cash, percent | .0 | .0 | .0 | .0 | .0 | .0 | .0 | .0 | .0 | .0 |
| Account Receivables | 10.4 | .0 | 16.6 | 10.9 | 15.1 | .0 | .0 | .0 | .0 | .0 |
| Account Receivables, % | 82.1 | 100 | 100 | 100 | 100 | 96.42 | 96.42 | 96.42 | 96.42 | 96.42 |
| Inventories | .0 | 2.7 | .0 | .0 | .0 | .0 | .0 | .0 | .0 | .0 |
| Inventories, % | 0 | 100 | 100 | 100 | 100 | 80 | 80 | 80 | 80 | 80 |
| Accounts Payable | 2.0 | 3.6 | 4.8 | 9.1 | 4.9 | .0 | .0 | .0 | .0 | .0 |
| Accounts Payable, % | 15.61 | 100 | 100 | 100 | 100 | 83.12 | 83.12 | 83.12 | 83.12 | 83.12 |
| Capital Expenditure | -.1 | -.9 | -1.2 | -.4 | -.4 | .0 | .0 | .0 | .0 | .0 |
| Capital Expenditure, % | -0.64618 | 100 | 100 | 100 | 100 | -0.12924 | -0.12924 | -0.12924 | -0.12924 | -0.12924 |
| Tax Rate, % | -1.88 | -1.88 | -1.88 | -1.88 | -1.88 | -1.88 | -1.88 | -1.88 | -1.88 | -1.88 |
| EBITAT | -44.5 | -68.5 | -74.9 | -126.6 | -177.6 | .0 | .0 | .0 | .0 | .0 |
| Depreciation | ||||||||||
| Changes in Account Receivables | ||||||||||
| Changes in Inventories | ||||||||||
| Changes in Accounts Payable | ||||||||||
| Capital Expenditure | ||||||||||
| UFCF | -52.4 | -59.3 | -87.9 | -116.3 | -185.5 | 10.3 | .0 | .0 | .0 | .0 |
| WACC, % | 5.48 | 5.35 | 5.32 | 5.46 | 5.52 | 5.42 | 5.42 | 5.42 | 5.42 | 5.42 |
| PV UFCF | ||||||||||
| SUM PV UFCF | 9.7 | |||||||||
| Long Term Growth Rate, % | 2.00 | |||||||||
| Free cash flow (T + 1) | 0 | |||||||||
| Terminal Value | 0 | |||||||||
| Present Terminal Value | 0 | |||||||||
| Enterprise Value | 10 | |||||||||
| Net Debt | -92 | |||||||||
| Equity Value | 102 | |||||||||
| Diluted Shares Outstanding, MM | 50 | |||||||||
| Equity Value Per Share | 2.06 |
What You Will Get
- Real KALV Financial Data: Pre-filled with KalVista Pharmaceuticals’ historical and projected data for precise analysis.
- Fully Editable Template: Modify key inputs like revenue growth, WACC, and EBITDA % with ease.
- Automatic Calculations: See KalVista Pharmaceuticals’ intrinsic value update instantly based on your changes.
- Professional Valuation Tool: Designed for investors, analysts, and consultants seeking accurate DCF results.
- User-Friendly Design: Simple structure and clear instructions for all experience levels.
Key Features
- Comprehensive KALV Data: Pre-filled with KalVista's historical performance metrics and future projections.
- Fully Customizable Inputs: Tailor revenue growth, profit margins, discount rates, tax implications, and capital investment plans.
- Dynamic Valuation Model: Automatically recalculates Net Present Value (NPV) and intrinsic value based on your specified inputs.
- Scenario Analysis: Develop various forecast scenarios to evaluate different valuation possibilities.
- User-Friendly Interface: Intuitive, organized, and suitable for both industry professionals and newcomers.
How It Works
- Step 1: Download the prebuilt Excel template with KalVista Pharmaceuticals' (KALV) data included.
- Step 2: Explore the pre-filled sheets and understand the key metrics for KalVista Pharmaceuticals.
- Step 3: Update forecasts and assumptions in the editable yellow cells (WACC, growth, margins).
- Step 4: Instantly view recalculated results, including KalVista Pharmaceuticals' intrinsic value.
- Step 5: Make informed investment decisions or generate reports using the outputs.
Why Choose This Calculator for KalVista Pharmaceuticals, Inc. (KALV)?
- Comprehensive Tool: Offers DCF, WACC, and financial ratio analyses tailored for KalVista Pharmaceuticals.
- Customizable Inputs: Modify yellow-highlighted cells to explore different financial scenarios specific to (KALV).
- Detailed Insights: Instantly calculates the intrinsic value and Net Present Value for KalVista Pharmaceuticals.
- Preloaded Data: Historical and projected data provide a solid foundation for analysis.
- Professional Quality: Perfect for financial analysts, investors, and consultants focusing on (KALV).
Who Should Use This Product?
- Pharmaceutical Students: Understand drug development processes and apply them using real-world case studies.
- Researchers: Integrate advanced models into your studies on drug efficacy and market analysis.
- Investors: Evaluate your investment strategies and analyze valuation metrics for KalVista Pharmaceuticals, Inc. (KALV).
- Market Analysts: Enhance your analysis with a tailored, user-friendly financial model specific to the biotech sector.
- Healthcare Entrepreneurs: Discover how established pharmaceutical companies like KalVista are valued and assessed.
What the Template Contains
- Pre-Filled DCF Model: KalVista Pharmaceuticals’ financial data preloaded for immediate use.
- WACC Calculator: Detailed calculations for Weighted Average Cost of Capital.
- Financial Ratios: Evaluate KalVista Pharmaceuticals’ profitability, leverage, and efficiency.
- Editable Inputs: Change assumptions such as growth, margins, and CAPEX to fit your scenarios.
- Financial Statements: Annual and quarterly reports to support detailed analysis.
- Interactive Dashboard: Easily visualize key valuation metrics and results.
Disclaimer
All information, articles, and product details provided on this website are for general informational and educational purposes only. We do not claim any ownership over, nor do we intend to infringe upon, any trademarks, copyrights, logos, brand names, or other intellectual property mentioned or depicted on this site. Such intellectual property remains the property of its respective owners, and any references here are made solely for identification or informational purposes, without implying any affiliation, endorsement, or partnership.
We make no representations or warranties, express or implied, regarding the accuracy, completeness, or suitability of any content or products presented. Nothing on this website should be construed as legal, tax, investment, financial, medical, or other professional advice. In addition, no part of this site—including articles or product references—constitutes a solicitation, recommendation, endorsement, advertisement, or offer to buy or sell any securities, franchises, or other financial instruments, particularly in jurisdictions where such activity would be unlawful.
All content is of a general nature and may not address the specific circumstances of any individual or entity. It is not a substitute for professional advice or services. Any actions you take based on the information provided here are strictly at your own risk. You accept full responsibility for any decisions or outcomes arising from your use of this website and agree to release us from any liability in connection with your use of, or reliance upon, the content or products found herein.