
|
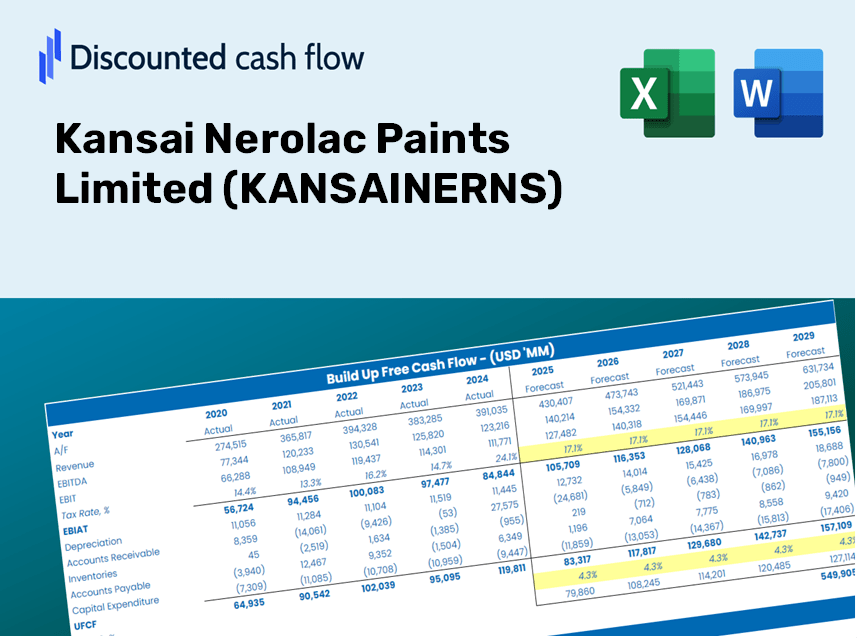
Kansai Nerolac Paints Limited (Kansainer.NS) DCF -Bewertung |
Fully Editable: Tailor To Your Needs In Excel Or Sheets
Professional Design: Trusted, Industry-Standard Templates
Investor-Approved Valuation Models
MAC/PC Compatible, Fully Unlocked
No Expertise Is Needed; Easy To Follow
Kansai Nerolac Paints Limited (KANSAINER.NS) Bundle
Unser (Kansainerns) DCF-Taschenrechner entwickelt für die Genauigkeit und ermöglicht es Ihnen, die Bewertung von Kansai Nerolac Paints Limited unter Verwendung realer Finanzdaten zu bewerten und vollständige Flexibilität zu bieten, um alle wesentlichen Parameter für erweiterte Projektionen zu ändern.
Discounted Cash Flow (DCF) - (USD MM)
| Year | AY1 2021 |
AY2 2022 |
AY3 2023 |
AY4 2024 |
AY5 2025 |
FY1 2026 |
FY2 2027 |
FY3 2028 |
FY4 2029 |
FY5 2030 |
|---|---|---|---|---|---|---|---|---|---|---|
| Revenue | 50,575.6 | 62,823.8 | 75,427.3 | 78,014.4 | 78,229.7 | 87,614.4 | 98,124.8 | 109,896.2 | 123,079.7 | 137,844.6 |
| Revenue Growth, % | 0 | 24.22 | 20.06 | 3.43 | 0.27597 | 12 | 12 | 12 | 12 | 12 |
| EBITDA | 9,013.6 | 6,739.7 | 8,439.7 | 17,808.8 | 9,423.2 | 13,074.2 | 14,642.6 | 16,399.2 | 18,366.5 | 20,569.8 |
| EBITDA, % | 17.82 | 10.73 | 11.19 | 22.83 | 12.05 | 14.92 | 14.92 | 14.92 | 14.92 | 14.92 |
| Depreciation | 1,653.0 | 1,697.7 | 1,800.8 | 1,904.6 | 2,017.0 | 2,344.2 | 2,625.4 | 2,940.3 | 3,293.1 | 3,688.1 |
| Depreciation, % | 3.27 | 2.7 | 2.39 | 2.44 | 2.58 | 2.68 | 2.68 | 2.68 | 2.68 | 2.68 |
| EBIT | 7,360.6 | 5,042.0 | 6,638.9 | 15,904.2 | 7,406.2 | 10,730.0 | 12,017.2 | 13,458.9 | 15,073.4 | 16,881.7 |
| EBIT, % | 14.55 | 8.03 | 8.8 | 20.39 | 9.47 | 12.25 | 12.25 | 12.25 | 12.25 | 12.25 |
| Total Cash | 7,902.2 | 3,130.0 | 6,343.9 | 15,807.2 | 21,360.4 | 13,419.7 | 15,029.6 | 16,832.6 | 18,851.9 | 21,113.4 |
| Total Cash, percent | .0 | .0 | .0 | .0 | .0 | .0 | .0 | .0 | .0 | .0 |
| Account Receivables | 10,147.9 | 11,165.4 | 12,462.7 | 13,415.8 | 13,755.5 | 15,619.9 | 17,493.7 | 19,592.3 | 21,942.7 | 24,575.0 |
| Account Receivables, % | 20.06 | 17.77 | 16.52 | 17.2 | 17.58 | 17.83 | 17.83 | 17.83 | 17.83 | 17.83 |
| Inventories | 11,979.3 | 16,295.5 | 17,291.3 | 16,874.6 | 16,650.7 | 20,232.5 | 22,659.6 | 25,377.9 | 28,422.4 | 31,832.0 |
| Inventories, % | 23.69 | 25.94 | 22.92 | 21.63 | 21.28 | 23.09 | 23.09 | 23.09 | 23.09 | 23.09 |
| Accounts Payable | 9,068.2 | 9,806.4 | 10,517.3 | 10,955.8 | 11,007.5 | 13,246.8 | 14,835.9 | 16,615.7 | 18,608.9 | 20,841.3 |
| Accounts Payable, % | 17.93 | 15.61 | 13.94 | 14.04 | 14.07 | 15.12 | 15.12 | 15.12 | 15.12 | 15.12 |
| Capital Expenditure | -1,037.9 | -2,190.1 | -1,231.7 | -2,370.0 | -3,263.0 | -2,519.8 | -2,822.1 | -3,160.7 | -3,539.8 | -3,964.5 |
| Capital Expenditure, % | -2.05 | -3.49 | -1.63 | -3.04 | -4.17 | -2.88 | -2.88 | -2.88 | -2.88 | -2.88 |
| Tax Rate, % | 22.67 | 22.67 | 22.67 | 22.67 | 22.67 | 22.67 | 22.67 | 22.67 | 22.67 | 22.67 |
| EBITAT | 5,473.0 | 3,797.9 | 4,952.1 | 12,076.2 | 5,727.2 | 8,101.9 | 9,073.8 | 10,162.3 | 11,381.4 | 12,746.8 |
| Depreciation | ||||||||||
| Changes in Account Receivables | ||||||||||
| Changes in Inventories | ||||||||||
| Changes in Accounts Payable | ||||||||||
| Capital Expenditure | ||||||||||
| UFCF | -6,970.9 | -1,290.0 | 3,939.0 | 11,512.9 | 4,417.1 | 4,719.3 | 6,165.3 | 6,904.9 | 7,733.2 | 8,660.9 |
| WACC, % | 4.73 | 4.73 | 4.73 | 4.73 | 4.73 | 4.73 | 4.73 | 4.73 | 4.73 | 4.73 |
| PV UFCF | ||||||||||
| SUM PV UFCF | 29,438.4 | |||||||||
| Long Term Growth Rate, % | 4.00 | |||||||||
| Free cash flow (T + 1) | 9,007 | |||||||||
| Terminal Value | 1,230,948 | |||||||||
| Present Terminal Value | 976,895 | |||||||||
| Enterprise Value | 1,006,334 | |||||||||
| Net Debt | 63 | |||||||||
| Equity Value | 1,006,270 | |||||||||
| Diluted Shares Outstanding, MM | 809 | |||||||||
| Equity Value Per Share | 1,243.15 |
What You Will Receive
- Customizable Excel Template: A fully adjustable Excel-based DCF Calculator featuring pre-filled financial data for Kansai Nerolac Paints Limited (KANSAINERNS).
- Accurate Data: Historical performance data along with forward-looking estimates (highlighted in the yellow cells).
- Flexible Forecasting: Adjust forecast parameters such as revenue growth, EBITDA %, and WACC.
- Real-Time Calculations: Instantly observe how your inputs influence the valuation of Kansai Nerolac Paints Limited (KANSAINERNS).
- Professional Resource: Designed for investors, CFOs, consultants, and financial analysts.
- Intuitive Layout: Organized for simplicity and ease of navigation, complete with step-by-step guidance.
Key Features
- Accurate KANSAINERNS Data: Pre-loaded with Kansai Nerolac's historical performance and future growth estimates.
- Customizable Variables: Modify revenue growth rates, profit margins, discount rates, tax implications, and capital investments.
- Adaptive Valuation Framework: Instant recalculations of Net Present Value (NPV) and intrinsic value based on your inputs.
- Scenario Analysis: Develop various forecasting scenarios to explore different valuation results.
- Intuitive User Interface: Clean, organized design suitable for both seasoned professionals and newcomers.
How It Works
- 1. Download the Template: Obtain and open the Excel file featuring Kansai Nerolac Paints Limited’s (KANSAINERNS) preloaded data.
- 2. Modify Assumptions: Adjust essential variables such as growth projections, WACC, and capital expenditures.
- 3. View Instant Results: The DCF model will automatically calculate the intrinsic value and NPV.
- 4. Explore Scenarios: Analyze different valuation outcomes by comparing various forecasts.
- 5. Make Informed Decisions: Utilize professional valuation insights to enhance your decision-making process.
Reasons to Choose Kansai Nerolac Paints Limited (KANSAINERNS)
- Time Efficient: Skip the hassle of complex calculations – our tools are ready for immediate use.
- Enhanced Precision: Dependable data and formulas minimize discrepancies in your evaluations.
- Fully Adaptable: Modify the model to suit your specific assumptions and forecasts.
- Intuitive Insights: User-friendly charts and visualizations simplify data interpretation.
- Endorsed by Professionals: Crafted for experts who prioritize accuracy and functionality.
Who Can Benefit from This Product?
- Students in Finance: Explore valuation techniques and implement them with real-world data.
- Researchers: Integrate professional valuation models into your studies and academic projects.
- Investors: Validate your investment hypotheses and analyze the valuation results for Kansai Nerolac Paints Limited (KANSAINERNS).
- Financial Analysts: Enhance your efficiency with a ready-to-use, customizable DCF model.
- Entrepreneurs: Understand the analytical approaches used for large public companies like Kansai Nerolac Paints Limited (KANSAINERNS).
Contents of the Template
- Preloaded KANSAINERNS Data: Historical and projected financial metrics, including revenue, EBIT, and capital expenditures.
- DCF and WACC Models: Professional-caliber sheets designed for calculating intrinsic value and Weighted Average Cost of Capital.
- Customizable Inputs: Yellow-highlighted cells for updating revenue growth, tax rates, and discount rates.
- Financial Statements: Detailed annual and quarterly financial reports for in-depth analysis.
- Key Ratios: Metrics for profitability, leverage, and efficiency to assess performance.
- Dashboard and Charts: Visual representations of valuation results and underlying assumptions.
Disclaimer
All information, articles, and product details provided on this website are for general informational and educational purposes only. We do not claim any ownership over, nor do we intend to infringe upon, any trademarks, copyrights, logos, brand names, or other intellectual property mentioned or depicted on this site. Such intellectual property remains the property of its respective owners, and any references here are made solely for identification or informational purposes, without implying any affiliation, endorsement, or partnership.
We make no representations or warranties, express or implied, regarding the accuracy, completeness, or suitability of any content or products presented. Nothing on this website should be construed as legal, tax, investment, financial, medical, or other professional advice. In addition, no part of this site—including articles or product references—constitutes a solicitation, recommendation, endorsement, advertisement, or offer to buy or sell any securities, franchises, or other financial instruments, particularly in jurisdictions where such activity would be unlawful.
All content is of a general nature and may not address the specific circumstances of any individual or entity. It is not a substitute for professional advice or services. Any actions you take based on the information provided here are strictly at your own risk. You accept full responsibility for any decisions or outcomes arising from your use of this website and agree to release us from any liability in connection with your use of, or reliance upon, the content or products found herein.