
|
Karooooo Ltd. (Karo) DCF -Bewertung |
Fully Editable: Tailor To Your Needs In Excel Or Sheets
Professional Design: Trusted, Industry-Standard Templates
Investor-Approved Valuation Models
MAC/PC Compatible, Fully Unlocked
No Expertise Is Needed; Easy To Follow
Karooooo Ltd. (KARO) Bundle
Optimieren Sie Ihre Analyse und verbessern Sie die Präzision mit unserem (Karo) DCF -Taschenrechner! Ausgestattet mit tatsächlichen Daten von Karooooo Ltd. und anpassbaren Annahmen ermöglichen Sie, dass Sie wie ein erfahrener Investor prognostizieren, bewerten und bewerten (Karo) bewerten und bewerten.
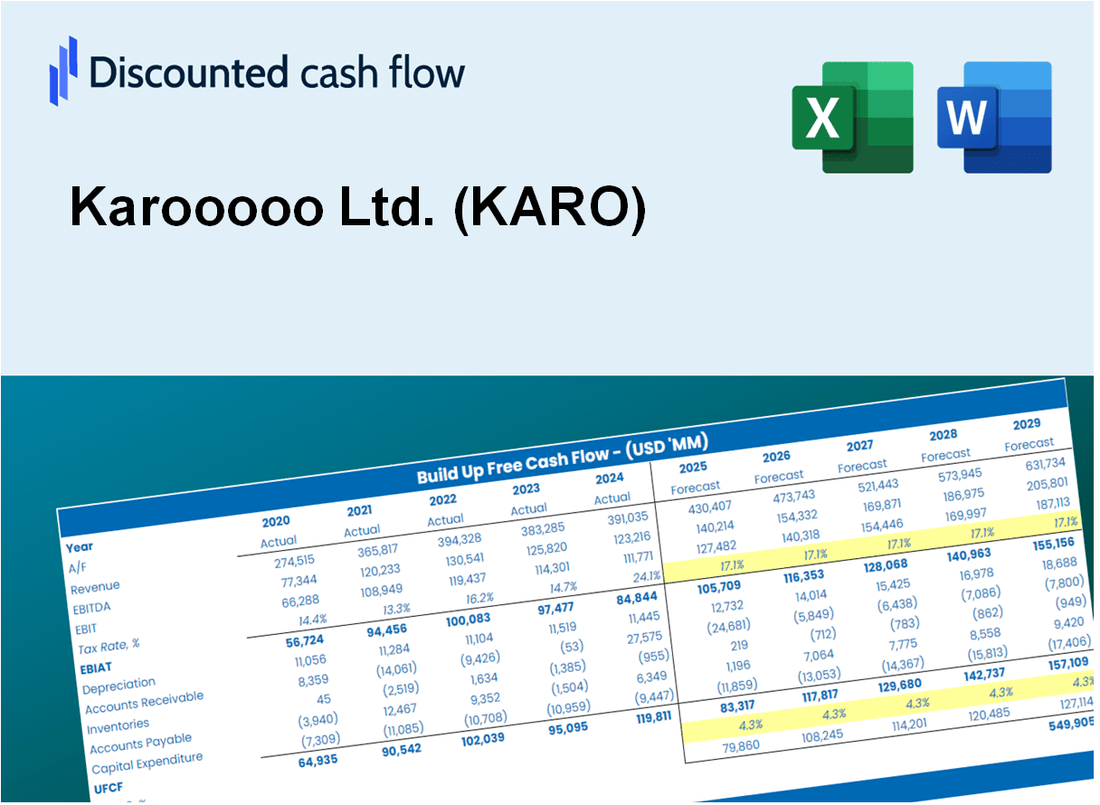
Discounted Cash Flow (DCF) - (USD MM)
| Year | AY1 2021 |
AY2 2022 |
AY3 2023 |
AY4 2024 |
AY5 2025 |
FY1 2026 |
FY2 2027 |
FY3 2028 |
FY4 2029 |
FY5 2030 |
|---|---|---|---|---|---|---|---|---|---|---|
| Revenue | 118.9 | 158.6 | 202.6 | 243.0 | 263.9 | 323.0 | 395.4 | 483.9 | 592.4 | 725.1 |
| Revenue Growth, % | 0 | 33.39 | 27.71 | 19.92 | 8.61 | 22.41 | 22.41 | 22.41 | 22.41 | 22.41 |
| EBITDA | 59.8 | 72.5 | 87.4 | 105.5 | 119.8 | 147.2 | 180.2 | 220.6 | 270.0 | 330.5 |
| EBITDA, % | 50.25 | 45.71 | 43.14 | 43.41 | 45.4 | 45.58 | 45.58 | 45.58 | 45.58 | 45.58 |
| Depreciation | 23.1 | 32.5 | 35.2 | 43.0 | 44.9 | 59.5 | 72.8 | 89.1 | 109.1 | 133.5 |
| Depreciation, % | 19.46 | 20.46 | 17.38 | 17.71 | 17.03 | 18.41 | 18.41 | 18.41 | 18.41 | 18.41 |
| EBIT | 36.6 | 40.1 | 52.2 | 62.4 | 74.9 | 87.8 | 107.4 | 131.5 | 161.0 | 197.0 |
| EBIT, % | 30.79 | 25.25 | 25.76 | 25.7 | 28.37 | 27.17 | 27.17 | 27.17 | 27.17 | 27.17 |
| Total Cash | 55.9 | 41.5 | 55.3 | 26.3 | 60.5 | 86.7 | 106.1 | 129.9 | 159.0 | 194.7 |
| Total Cash, percent | .0 | .0 | .0 | .0 | .0 | .0 | .0 | .0 | .0 | .0 |
| Account Receivables | 16.4 | 18.4 | 20.2 | 23.8 | 27.5 | 35.9 | 43.9 | 53.8 | 65.8 | 80.6 |
| Account Receivables, % | 13.83 | 11.58 | 9.95 | 9.78 | 10.42 | 11.11 | 11.11 | 11.11 | 11.11 | 11.11 |
| Inventories | .0 | 1.4 | 4.5 | .4 | .2 | 2.2 | 2.7 | 3.3 | 4.0 | 4.9 |
| Inventories, % | 0 | 0.90798 | 2.24 | 0.15532 | 0.08415259 | 0.67698 | 0.67698 | 0.67698 | 0.67698 | 0.67698 |
| Accounts Payable | 5.2 | 5.6 | 15.6 | 21.1 | 21.6 | 21.0 | 25.7 | 31.4 | 38.5 | 47.1 |
| Accounts Payable, % | 4.35 | 3.56 | 7.7 | 8.7 | 8.18 | 6.5 | 6.5 | 6.5 | 6.5 | 6.5 |
| Capital Expenditure | -24.8 | -32.6 | -36.5 | -51.6 | -60.2 | -66.8 | -81.8 | -100.2 | -122.6 | -150.1 |
| Capital Expenditure, % | -20.87 | -20.58 | -17.99 | -21.23 | -22.82 | -20.7 | -20.7 | -20.7 | -20.7 | -20.7 |
| Tax Rate, % | 26.14 | 26.14 | 26.14 | 26.14 | 26.14 | 26.14 | 26.14 | 26.14 | 26.14 | 26.14 |
| EBITAT | 16.7 | 26.4 | 34.9 | 44.0 | 55.3 | 56.7 | 69.4 | 84.9 | 104.0 | 127.2 |
| Depreciation | ||||||||||
| Changes in Account Receivables | ||||||||||
| Changes in Inventories | ||||||||||
| Changes in Accounts Payable | ||||||||||
| Capital Expenditure | ||||||||||
| UFCF | 3.8 | 23.4 | 38.7 | 41.6 | 36.9 | 38.3 | 56.5 | 69.2 | 84.7 | 103.6 |
| WACC, % | 8.62 | 8.66 | 8.66 | 8.67 | 8.68 | 8.66 | 8.66 | 8.66 | 8.66 | 8.66 |
| PV UFCF | ||||||||||
| SUM PV UFCF | 266.2 | |||||||||
| Long Term Growth Rate, % | 3.00 | |||||||||
| Free cash flow (T + 1) | 107 | |||||||||
| Terminal Value | 1,886 | |||||||||
| Present Terminal Value | 1,245 | |||||||||
| Enterprise Value | 1,512 | |||||||||
| Net Debt | -18 | |||||||||
| Equity Value | 1,530 | |||||||||
| Diluted Shares Outstanding, MM | 31 | |||||||||
| Equity Value Per Share | 49.52 |
What You Will Receive
- Customizable Excel Template: A fully adaptable Excel-based DCF Calculator featuring pre-filled real KARO financials.
- Actual Data: Historical figures and forward-looking projections (as illustrated in the highlighted cells).
- Flexible Forecasting: Adjust forecast assumptions such as revenue growth, EBITDA %, and WACC.
- Instant Calculations: Quickly observe how your inputs affect Karooooo’s valuation.
- Professional Resource: Designed for investors, CFOs, consultants, and financial analysts.
- User-Centric Layout: Organized for clarity and ease of navigation, complete with step-by-step guidelines.
Key Features
- Comprehensive Financial Data: Gain access to reliable historical performance and future forecasts for Karooooo Ltd. (KARO).
- Adjustable Forecast Parameters: Modify highlighted fields such as WACC, growth rates, and profit margins to suit your analysis.
- Real-Time Calculations: Enjoy automatic recalculations for DCF, Net Present Value (NPV), and cash flow assessments.
- User-Friendly Dashboard: View intuitive charts and summaries that simplify your valuation insights.
- Designed for All Skill Levels: An accessible layout tailored for investors, financial officers, and consultants alike.
How It Works
- 1. Access the Template: Download and open the Excel file containing Karooooo Ltd.’s (KARO) financial data.
- 2. Modify Assumptions: Adjust critical inputs such as growth projections, WACC, and capital expenditures.
- 3. Analyze Results Instantly: The DCF model automatically computes intrinsic value and NPV based on your inputs.
- 4. Explore Scenarios: Evaluate various forecasts to understand different valuation scenarios.
- 5. Present with Assurance: Deliver professional valuation insights to back your investment strategies.
Why Choose This Calculator for Karooooo Ltd. (KARO)?
- Accurate Data: Utilize authentic Karooooo financials for dependable valuation outcomes.
- Customizable: Modify essential parameters such as growth rates, WACC, and tax rates to align with your forecasts.
- Time-Saving: Built-in calculations save you from starting from square one.
- Professional-Grade Tool: Tailored for investors, analysts, and consultants in the industry.
- User-Friendly: Easy-to-navigate design and clear instructions ensure accessibility for all users.
Who Should Use This Product?
- Professional Investors: Develop comprehensive and accurate valuation models for portfolio assessment of Karooooo Ltd. (KARO).
- Corporate Finance Teams: Evaluate valuation scenarios to inform strategic decisions within the organization.
- Consultants and Advisors: Deliver precise valuation insights for clients interested in Karooooo Ltd. (KARO) stock.
- Students and Educators: Utilize real-world data to enhance learning and practice in financial modeling.
- Tech Enthusiasts: Gain insights into how technology firms like Karooooo Ltd. (KARO) are assessed in the financial market.
What the Template Contains
- Preloaded KARO Data: Historical and projected financial data, including revenue, EBIT, and capital expenditures.
- DCF and WACC Models: Professional-grade sheets for calculating intrinsic value and Weighted Average Cost of Capital.
- Editable Inputs: Yellow-highlighted cells for adjusting revenue growth, tax rates, and discount rates.
- Financial Statements: Comprehensive annual and quarterly financials for deeper analysis.
- Key Ratios: Profitability, leverage, and efficiency ratios to evaluate performance.
- Dashboard and Charts: Visual summaries of valuation outcomes and assumptions.
Disclaimer
All information, articles, and product details provided on this website are for general informational and educational purposes only. We do not claim any ownership over, nor do we intend to infringe upon, any trademarks, copyrights, logos, brand names, or other intellectual property mentioned or depicted on this site. Such intellectual property remains the property of its respective owners, and any references here are made solely for identification or informational purposes, without implying any affiliation, endorsement, or partnership.
We make no representations or warranties, express or implied, regarding the accuracy, completeness, or suitability of any content or products presented. Nothing on this website should be construed as legal, tax, investment, financial, medical, or other professional advice. In addition, no part of this site—including articles or product references—constitutes a solicitation, recommendation, endorsement, advertisement, or offer to buy or sell any securities, franchises, or other financial instruments, particularly in jurisdictions where such activity would be unlawful.
All content is of a general nature and may not address the specific circumstances of any individual or entity. It is not a substitute for professional advice or services. Any actions you take based on the information provided here are strictly at your own risk. You accept full responsibility for any decisions or outcomes arising from your use of this website and agree to release us from any liability in connection with your use of, or reliance upon, the content or products found herein.