
|
KB Home (KBH) DCF -Bewertung |
Fully Editable: Tailor To Your Needs In Excel Or Sheets
Professional Design: Trusted, Industry-Standard Templates
Investor-Approved Valuation Models
MAC/PC Compatible, Fully Unlocked
No Expertise Is Needed; Easy To Follow
KB Home (KBH) Bundle
Optimieren Sie Ihre Zeit und verbessern Sie die Präzision mit unserem (KBH) DCF -Taschenrechner! Ausgestattet mit echten Daten von KB Home und anpassbaren Annahmen ermöglicht es Ihnen, KB Home wie ein erfahrener Investor zu prognostizieren, zu analysieren und zu bewerten.
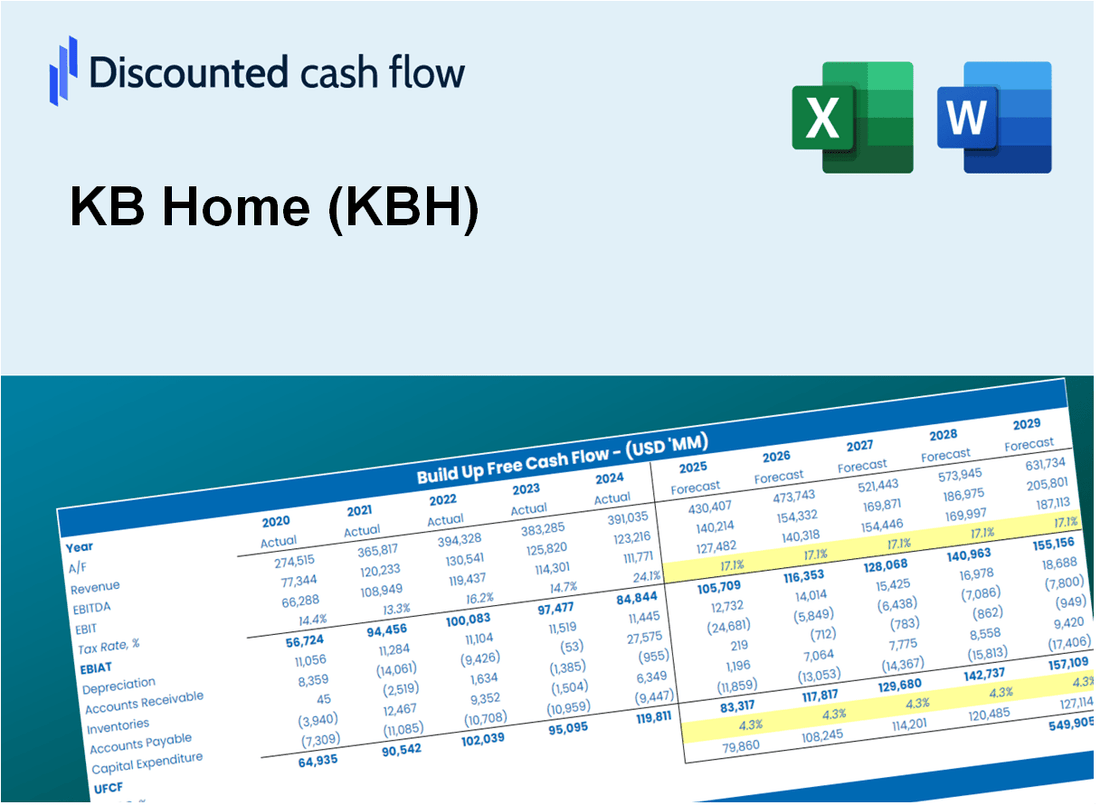
Discounted Cash Flow (DCF) - (USD MM)
| Year | AY1 2020 |
AY2 2021 |
AY3 2022 |
AY4 2023 |
AY5 2024 |
FY1 2025 |
FY2 2026 |
FY3 2027 |
FY4 2028 |
FY5 2029 |
|---|---|---|---|---|---|---|---|---|---|---|
| Revenue | 4,183.2 | 5,724.9 | 6,903.8 | 6,410.6 | 6,930.1 | 7,942.0 | 9,101.7 | 10,430.7 | 11,953.8 | 13,699.3 |
| Revenue Growth, % | 0 | 36.86 | 20.59 | -7.14 | 8.1 | 14.6 | 14.6 | 14.6 | 14.6 | 14.6 |
| EBITDA | 392.4 | 724.0 | 1,104.4 | 778.9 | 888.2 | 1,000.6 | 1,146.7 | 1,314.1 | 1,506.0 | 1,725.9 |
| EBITDA, % | 9.38 | 12.65 | 16 | 12.15 | 12.82 | 12.6 | 12.6 | 12.6 | 12.6 | 12.6 |
| Depreciation | 28.4 | 28.6 | 32.3 | 36.4 | 37.3 | 43.7 | 50.1 | 57.4 | 65.8 | 75.4 |
| Depreciation, % | 0.67881 | 0.50027 | 0.46814 | 0.56801 | 0.53783 | 0.55061 | 0.55061 | 0.55061 | 0.55061 | 0.55061 |
| EBIT | 364.0 | 695.3 | 1,072.1 | 742.5 | 850.9 | 956.8 | 1,096.5 | 1,256.7 | 1,440.2 | 1,650.4 |
| EBIT, % | 8.7 | 12.15 | 15.53 | 11.58 | 12.28 | 12.05 | 12.05 | 12.05 | 12.05 | 12.05 |
| Total Cash | 681.2 | 290.8 | 330.2 | 727.3 | 599.2 | 732.9 | 839.9 | 962.5 | 1,103.0 | 1,264.1 |
| Total Cash, percent | .0 | .0 | .0 | .0 | .0 | .0 | .0 | .0 | .0 | .0 |
| Account Receivables | 274.6 | 306.4 | 326.2 | 369.6 | 382.9 | 443.7 | 508.5 | 582.7 | 667.8 | 765.4 |
| Account Receivables, % | 6.57 | 5.35 | 4.73 | 5.77 | 5.53 | 5.59 | 5.59 | 5.59 | 5.59 | 5.59 |
| Inventories | 3,897.5 | 4,802.8 | 5,543.2 | 5,133.6 | 5,528.0 | 6,626.9 | 7,594.5 | 8,703.5 | 9,974.3 | 11,430.8 |
| Inventories, % | 93.17 | 83.89 | 80.29 | 80.08 | 79.77 | 83.44 | 83.44 | 83.44 | 83.44 | 83.44 |
| Accounts Payable | 273.4 | 371.8 | 412.5 | 390.1 | 387.6 | 487.4 | 558.5 | 640.1 | 733.6 | 840.7 |
| Accounts Payable, % | 6.53 | 6.49 | 5.98 | 6.09 | 5.59 | 6.14 | 6.14 | 6.14 | 6.14 | 6.14 |
| Capital Expenditure | -28.8 | -39.4 | -45.2 | -35.5 | -39.3 | -50.1 | -57.4 | -65.8 | -75.4 | -86.4 |
| Capital Expenditure, % | -0.68945 | -0.6882 | -0.65521 | -0.55327 | -0.56725 | -0.63068 | -0.63068 | -0.63068 | -0.63068 | -0.63068 |
| Tax Rate, % | 23.02 | 23.02 | 23.02 | 23.02 | 23.02 | 23.02 | 23.02 | 23.02 | 23.02 | 23.02 |
| EBITAT | 296.2 | 564.7 | 816.7 | 568.2 | 655.0 | 750.7 | 860.3 | 985.9 | 1,129.9 | 1,294.8 |
| Depreciation | ||||||||||
| Changes in Account Receivables | ||||||||||
| Changes in Inventories | ||||||||||
| Changes in Accounts Payable | ||||||||||
| Capital Expenditure | ||||||||||
| UFCF | -3,603.0 | -284.6 | 84.2 | 912.8 | 242.8 | -315.6 | -108.3 | -124.1 | -142.2 | -163.0 |
| WACC, % | 8.38 | 8.37 | 8.32 | 8.33 | 8.33 | 8.35 | 8.35 | 8.35 | 8.35 | 8.35 |
| PV UFCF | ||||||||||
| SUM PV UFCF | -693.4 | |||||||||
| Long Term Growth Rate, % | 1.00 | |||||||||
| Free cash flow (T + 1) | -165 | |||||||||
| Terminal Value | -2,241 | |||||||||
| Present Terminal Value | -1,501 | |||||||||
| Enterprise Value | -2,194 | |||||||||
| Net Debt | 1,113 | |||||||||
| Equity Value | -3,308 | |||||||||
| Diluted Shares Outstanding, MM | 77 | |||||||||
| Equity Value Per Share | -42.98 |
What You Will Get
- Real KB Home Data: Preloaded financials – from revenue to EBIT – based on actual and projected figures.
- Full Customization: Adjust all critical parameters (yellow cells) like WACC, growth %, and tax rates.
- Instant Valuation Updates: Automatic recalculations to analyze the impact of changes on KB Home’s fair value.
- Versatile Excel Template: Tailored for quick edits, scenario testing, and detailed projections.
- Time-Saving and Accurate: Skip building models from scratch while maintaining precision and flexibility.
Key Features
- Comprehensive DCF Calculator: Offers detailed unlevered and levered DCF valuation models tailored for KB Home (KBH).
- WACC Calculator: Features a pre-built Weighted Average Cost of Capital sheet with customizable inputs specific to KB Home (KBH).
- Adjustable Forecast Assumptions: Easily modify growth rates, capital expenditures, and discount rates for KB Home (KBH).
- Integrated Financial Ratios: Assess profitability, leverage, and efficiency ratios relevant to KB Home (KBH).
- Interactive Dashboard and Charts: Visual representations summarize key valuation metrics for straightforward analysis of KB Home (KBH).
How It Works
- 1. Access the Template: Download and open the Excel file containing KB Home’s (KBH) preloaded data.
- 2. Modify Assumptions: Adjust key inputs such as growth rates, WACC, and capital expenditures.
- 3. View Results Instantly: The DCF model automatically calculates intrinsic value and NPV for KB Home (KBH).
- 4. Explore Scenarios: Analyze different valuation outcomes by comparing multiple forecasts.
- 5. Present with Confidence: Share professional valuation insights to enhance your decision-making for KB Home (KBH).
Why Choose This Calculator for KB Home (KBH)?
- Comprehensive Tool: Offers DCF, WACC, and financial ratio analyses all in one solution.
- Customizable Inputs: Modify yellow-highlighted cells to explore different scenarios.
- Detailed Insights: Automatically computes KB Home’s intrinsic value and Net Present Value.
- Preloaded Data: Includes historical and projected data for reliable starting points.
- Professional Quality: Perfect for financial analysts, investors, and business consultants.
Who Should Use This Product?
- Investors: Evaluate KB Home’s (KBH) market performance before making investment decisions.
- CFOs and Financial Analysts: Optimize valuation methodologies and assess financial forecasts.
- Startup Founders: Understand the valuation strategies of established homebuilders like KB Home.
- Consultants: Create detailed valuation reports for real estate clients.
- Students and Educators: Utilize current market data to learn and teach valuation principles.
What the Template Contains
- Pre-Filled Data: Includes KB Home's historical financials and forecasts.
- Discounted Cash Flow Model: Editable DCF valuation model with automatic calculations.
- Weighted Average Cost of Capital (WACC): A dedicated sheet for calculating WACC based on custom inputs.
- Key Financial Ratios: Analyze KB Home's profitability, efficiency, and leverage.
- Customizable Inputs: Edit revenue growth, margins, and tax rates with ease.
- Clear Dashboard: Charts and tables summarizing key valuation results.
Disclaimer
All information, articles, and product details provided on this website are for general informational and educational purposes only. We do not claim any ownership over, nor do we intend to infringe upon, any trademarks, copyrights, logos, brand names, or other intellectual property mentioned or depicted on this site. Such intellectual property remains the property of its respective owners, and any references here are made solely for identification or informational purposes, without implying any affiliation, endorsement, or partnership.
We make no representations or warranties, express or implied, regarding the accuracy, completeness, or suitability of any content or products presented. Nothing on this website should be construed as legal, tax, investment, financial, medical, or other professional advice. In addition, no part of this site—including articles or product references—constitutes a solicitation, recommendation, endorsement, advertisement, or offer to buy or sell any securities, franchises, or other financial instruments, particularly in jurisdictions where such activity would be unlawful.
All content is of a general nature and may not address the specific circumstances of any individual or entity. It is not a substitute for professional advice or services. Any actions you take based on the information provided here are strictly at your own risk. You accept full responsibility for any decisions or outcomes arising from your use of this website and agree to release us from any liability in connection with your use of, or reliance upon, the content or products found herein.