
|
Kesoram Industries Limited (Kesoramind.NS) DCF -Bewertung |
Fully Editable: Tailor To Your Needs In Excel Or Sheets
Professional Design: Trusted, Industry-Standard Templates
Investor-Approved Valuation Models
MAC/PC Compatible, Fully Unlocked
No Expertise Is Needed; Easy To Follow
Kesoram Industries Limited (KESORAMIND.NS) Bundle
Gewinnen Sie einen Einblick in Ihre Kesoram Industries Limited (Kesoramindns) Bewertungsanalyse unter Verwendung unseres hochmodernen DCF-Taschenrechners! Diese Excel -Vorlage wird mit authentischen Kesoramindns -Daten vorinstalliert, sodass Sie Prognosen und Annahmen anpassen können, um die intrinsische Wert von Kesoram Industries Limited genau zu bestimmen.
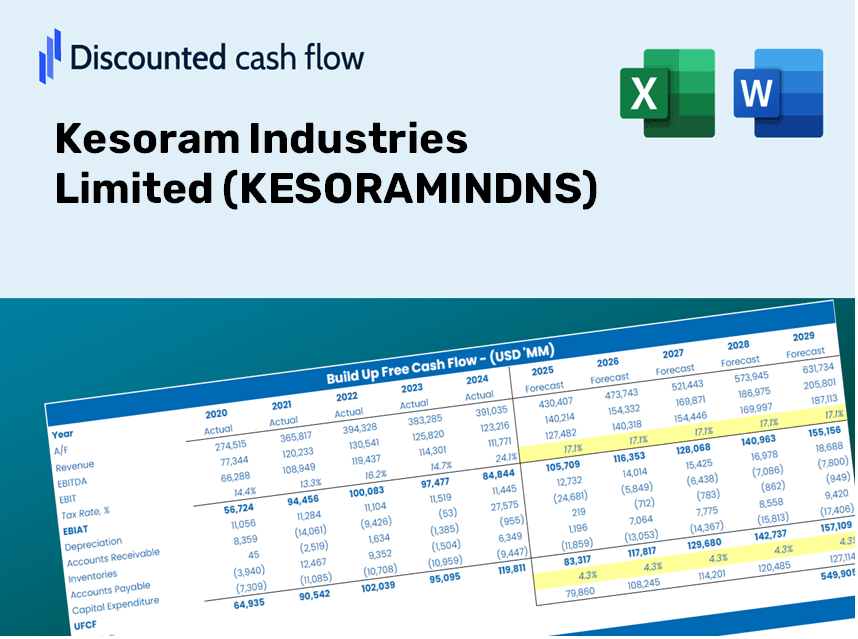
Discounted Cash Flow (DCF) - (USD MM)
| Year | AY1 2021 |
AY2 2022 |
AY3 2023 |
AY4 2024 |
AY5 2025 |
FY1 2026 |
FY2 2027 |
FY3 2028 |
FY4 2029 |
FY5 2030 |
|---|---|---|---|---|---|---|---|---|---|---|
| Revenue | 26,476.7 | 35,994.3 | 37,780.5 | 39,868.8 | 2,587.6 | 2,283.1 | 2,014.4 | 1,777.3 | 1,568.2 | 1,383.6 |
| Revenue Growth, % | 0 | 35.95 | 4.96 | 5.53 | -93.51 | -11.77 | -11.77 | -11.77 | -11.77 | -11.77 |
| EBITDA | 2,268.2 | 5,129.6 | 1,576.1 | 3,413.8 | -516.7 | 71.2 | 62.8 | 55.4 | 48.9 | 43.1 |
| EBITDA, % | 8.57 | 14.25 | 4.17 | 8.56 | -19.97 | 3.12 | 3.12 | 3.12 | 3.12 | 3.12 |
| Depreciation | 1,179.6 | 1,117.6 | 1,025.2 | 1,368.9 | 321.2 | 119.3 | 105.2 | 92.8 | 81.9 | 72.3 |
| Depreciation, % | 4.46 | 3.1 | 2.71 | 3.43 | 12.41 | 5.22 | 5.22 | 5.22 | 5.22 | 5.22 |
| EBIT | 1,088.6 | 4,012.0 | 550.9 | 2,044.9 | -837.9 | -48.1 | -42.4 | -37.5 | -33.0 | -29.2 |
| EBIT, % | 4.11 | 11.15 | 1.46 | 5.13 | -32.38 | -2.11 | -2.11 | -2.11 | -2.11 | -2.11 |
| Total Cash | 1,119.4 | 1,349.2 | 547.7 | 1,479.4 | 292.4 | 111.6 | 98.5 | 86.9 | 76.6 | 67.6 |
| Total Cash, percent | .0 | .0 | .0 | .0 | .0 | .0 | .0 | .0 | .0 | .0 |
| Account Receivables | 4,374.1 | 5,071.5 | 4,845.7 | 4,681.0 | 323.6 | 309.1 | 272.7 | 240.6 | 212.3 | 187.3 |
| Account Receivables, % | 16.52 | 14.09 | 12.83 | 11.74 | 12.51 | 13.54 | 13.54 | 13.54 | 13.54 | 13.54 |
| Inventories | 1,372.1 | 1,804.3 | 2,320.8 | 2,865.9 | 364.2 | 171.7 | 151.5 | 133.7 | 117.9 | 104.1 |
| Inventories, % | 5.18 | 5.01 | 6.14 | 7.19 | 14.07 | 7.52 | 7.52 | 7.52 | 7.52 | 7.52 |
| Accounts Payable | 3,939.7 | 3,692.0 | 3,198.6 | 6,228.5 | 353.5 | 287.2 | 253.4 | 223.5 | 197.2 | 174.0 |
| Accounts Payable, % | 14.88 | 10.26 | 8.47 | 15.62 | 13.66 | 12.58 | 12.58 | 12.58 | 12.58 | 12.58 |
| Capital Expenditure | -278.6 | -356.2 | -726.6 | -940.3 | -60.4 | -39.5 | -34.9 | -30.8 | -27.2 | -24.0 |
| Capital Expenditure, % | -1.05 | -0.9896 | -1.92 | -2.36 | -2.33 | -1.73 | -1.73 | -1.73 | -1.73 | -1.73 |
| Tax Rate, % | 6212.2 | 6212.2 | 6212.2 | 6212.2 | 6212.2 | 6212.2 | 6212.2 | 6212.2 | 6212.2 | 6212.2 |
| EBITAT | -913.6 | 3,557.9 | 278.1 | 2,864.1 | 51,214.1 | -23.0 | -20.3 | -17.9 | -15.8 | -13.9 |
| Depreciation | ||||||||||
| Changes in Account Receivables | ||||||||||
| Changes in Inventories | ||||||||||
| Changes in Accounts Payable | ||||||||||
| Capital Expenditure | ||||||||||
| UFCF | -1,819.1 | 2,942.0 | -207.4 | 5,942.2 | 52,459.0 | 197.4 | 72.8 | 64.3 | 56.7 | 50.0 |
| WACC, % | 3.47 | 10.47 | 7.46 | 11.37 | 3.47 | 7.25 | 7.25 | 7.25 | 7.25 | 7.25 |
| PV UFCF | ||||||||||
| SUM PV UFCF | 377.6 | |||||||||
| Long Term Growth Rate, % | 3.00 | |||||||||
| Free cash flow (T + 1) | 52 | |||||||||
| Terminal Value | 1,213 | |||||||||
| Present Terminal Value | 855 | |||||||||
| Enterprise Value | 1,233 | |||||||||
| Net Debt | 1,847 | |||||||||
| Equity Value | -614 | |||||||||
| Diluted Shares Outstanding, MM | 311 | |||||||||
| Equity Value Per Share | -1.98 |
What You Will Receive
- Comprehensive KESORAMINDNS Financial Data: Access to historical figures and projections for precise valuation.
- Customizable Parameters: Adjust inputs such as WACC, tax rates, revenue growth, and capital expenditures.
- Instant Calculations: Intrinsic value and NPV are calculated in real-time.
- What-If Analysis: Explore various scenarios to assess Kesoram Industries' future performance.
- User-Friendly Interface: Designed for professionals but easy to navigate for newcomers.
Key Features
- Pre-Loaded Data: Kesoram Industries Limited’s historical financial statements and pre-filled forecasts.
- Fully Adjustable Inputs: Modify WACC, tax rates, revenue growth, and EBITDA margins as needed.
- Instant Results: Watch Kesoram Industries Limited’s intrinsic value recalculate in real time.
- Clear Visual Outputs: Dashboard charts provide a clear view of valuation results and key metrics.
- Designed for Precision: A professional-grade tool for analysts, investors, and finance professionals.
How It Operates
- Step 1: Download the Excel file.
- Step 2: Examine the pre-filled Kesoram Industries Limited (KESORAMINDNS) data (both historical and forecasted).
- Step 3: Modify key assumptions (highlighted in yellow) based on your insights.
- Step 4: Observe automatic updates for Kesoram’s intrinsic value.
- Step 5: Utilize the results for investment strategies or reports.
Why Opt for This Calculator?
- Reliable Information: Utilizes authentic Kesoram Industries Limited (KESORAMINDNS) financials for trustworthy valuation outcomes.
- Tailor-Made: Modify essential parameters such as growth rates, WACC, and tax rates to align with your forecasts.
- Efficiency Booster: Preconfigured calculations save you the hassle of starting from scratch.
- Advanced Tool: Crafted for the needs of investors, analysts, and consultants.
- Easy to Use: Intuitive design and clear, step-by-step guidance cater to users of all experience levels.
Who Can Benefit from This Product?
- Professional Investors: Develop comprehensive and trustworthy valuation models for portfolio evaluation.
- Corporate Finance Teams: Assess valuation scenarios to inform strategic decision-making.
- Consultants and Advisors: Deliver precise valuation insights for Kesoram Industries Limited (KESORAMINDNS) to clients.
- Students and Educators: Utilize real-world data for practicing and teaching financial modeling techniques.
- Industry Enthusiasts: Gain insights into how companies like Kesoram Industries Limited (KESORAMINDNS) are appraised in the market.
Contents of the Template
- Pre-Filled DCF Model: Kesoram Industries Limited's financial data preloaded for immediate application.
- WACC Calculator: Comprehensive calculations for the Weighted Average Cost of Capital.
- Financial Ratios: Assess Kesoram's profitability, leverage, and efficiency metrics.
- Editable Inputs: Modify assumptions such as growth projections, margins, and CAPEX to suit your analysis.
- Financial Statements: Access to annual and quarterly reports for thorough assessment.
- Interactive Dashboard: Conveniently visualize essential valuation metrics and outcomes.
Disclaimer
All information, articles, and product details provided on this website are for general informational and educational purposes only. We do not claim any ownership over, nor do we intend to infringe upon, any trademarks, copyrights, logos, brand names, or other intellectual property mentioned or depicted on this site. Such intellectual property remains the property of its respective owners, and any references here are made solely for identification or informational purposes, without implying any affiliation, endorsement, or partnership.
We make no representations or warranties, express or implied, regarding the accuracy, completeness, or suitability of any content or products presented. Nothing on this website should be construed as legal, tax, investment, financial, medical, or other professional advice. In addition, no part of this site—including articles or product references—constitutes a solicitation, recommendation, endorsement, advertisement, or offer to buy or sell any securities, franchises, or other financial instruments, particularly in jurisdictions where such activity would be unlawful.
All content is of a general nature and may not address the specific circumstances of any individual or entity. It is not a substitute for professional advice or services. Any actions you take based on the information provided here are strictly at your own risk. You accept full responsibility for any decisions or outcomes arising from your use of this website and agree to release us from any liability in connection with your use of, or reliance upon, the content or products found herein.