
|
KFIN Technologies Limited (KFINTech.NS) DCF -Bewertung |
Fully Editable: Tailor To Your Needs In Excel Or Sheets
Professional Design: Trusted, Industry-Standard Templates
Investor-Approved Valuation Models
MAC/PC Compatible, Fully Unlocked
No Expertise Is Needed; Easy To Follow
KFin Technologies Limited (KFINTECH.NS) Bundle
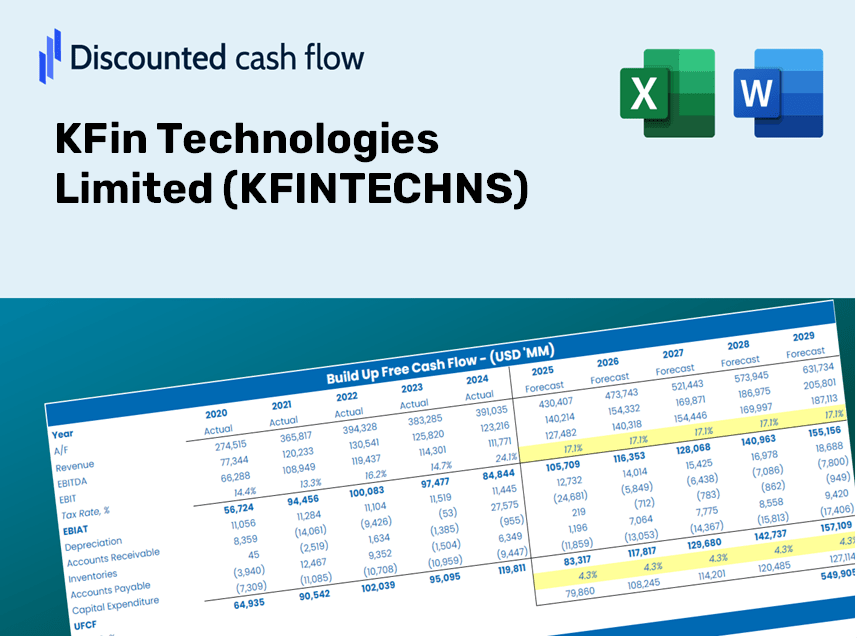
Gewinnen Sie Einblicke in Ihre KFIN Technologies Limited (KFINTECHNS) Bewertungsanalyse unter Verwendung unseres ausgefeilten DCF -Taschenrechners! Diese Excel -Vorlage wird mit tatsächlichen (KFINTECHNS) -Daten vorinstalliert, sodass Sie Prognosen und Annahmen anpassen können, um den inneren Wert von Kfin -Technologies Limited genau zu bestimmen.
Discounted Cash Flow (DCF) - (USD MM)
| Year | AY1 2021 |
AY2 2022 |
AY3 2023 |
AY4 2024 |
AY5 2025 |
FY1 2026 |
FY2 2027 |
FY3 2028 |
FY4 2029 |
FY5 2030 |
|---|---|---|---|---|---|---|---|---|---|---|
| Revenue | 4,612.4 | 6,395.1 | 6,934.2 | 8,375.3 | 11,077.3 | 13,850.1 | 17,316.9 | 21,651.6 | 27,071.2 | 33,847.5 |
| Revenue Growth, % | 0 | 38.65 | 8.43 | 20.78 | 32.26 | 25.03 | 25.03 | 25.03 | 25.03 | 25.03 |
| EBITDA | 2,174.5 | 2,939.1 | 3,151.6 | 3,888.4 | 5,167.3 | 6,416.1 | 8,022.2 | 10,030.2 | 12,540.9 | 15,680.0 |
| EBITDA, % | 47.15 | 45.96 | 45.45 | 46.43 | 46.65 | 46.33 | 46.33 | 46.33 | 46.33 | 46.33 |
| Depreciation | 979.9 | 370.3 | 466.7 | 530.2 | 644.5 | 1,271.8 | 1,590.2 | 1,988.2 | 2,485.9 | 3,108.1 |
| Depreciation, % | 21.24 | 5.79 | 6.73 | 6.33 | 5.82 | 9.18 | 9.18 | 9.18 | 9.18 | 9.18 |
| EBIT | 1,194.6 | 2,568.8 | 2,684.9 | 3,358.2 | 4,522.8 | 5,144.3 | 6,432.0 | 8,042.0 | 10,055.0 | 12,571.9 |
| EBIT, % | 25.9 | 40.17 | 38.72 | 40.1 | 40.83 | 37.14 | 37.14 | 37.14 | 37.14 | 37.14 |
| Total Cash | 1,198.3 | 1,469.1 | 2,976.4 | 4,000.9 | 6,536.9 | 5,502.9 | 6,880.3 | 8,602.6 | 10,755.9 | 13,448.2 |
| Total Cash, percent | .0 | .0 | .0 | .0 | .0 | .0 | .0 | .0 | .0 | .0 |
| Account Receivables | 1,211.3 | 1,224.7 | 1,432.1 | 1,643.5 | 1,926.6 | 2,855.3 | 3,570.1 | 4,463.7 | 5,581.0 | 6,978.0 |
| Account Receivables, % | 26.26 | 19.15 | 20.65 | 19.62 | 17.39 | 20.62 | 20.62 | 20.62 | 20.62 | 20.62 |
| Inventories | .0 | .0 | .0 | .0 | .0 | .0 | .0 | .0 | .0 | .0 |
| Inventories, % | 0 | 0 | 0 | 0 | 0 | 0 | 0 | 0 | 0 | 0 |
| Accounts Payable | 252.6 | 255.3 | 261.5 | 354.6 | 670.5 | 651.7 | 814.8 | 1,018.8 | 1,273.8 | 1,592.6 |
| Accounts Payable, % | 5.48 | 3.99 | 3.77 | 4.23 | 6.05 | 4.71 | 4.71 | 4.71 | 4.71 | 4.71 |
| Capital Expenditure | -297.0 | -680.8 | -700.5 | -850.9 | -861.5 | -1,249.9 | -1,562.8 | -1,954.0 | -2,443.1 | -3,054.7 |
| Capital Expenditure, % | -6.44 | -10.65 | -10.1 | -10.16 | -7.78 | -9.02 | -9.02 | -9.02 | -9.02 | -9.02 |
| Tax Rate, % | 25.69 | 25.69 | 25.69 | 25.69 | 25.69 | 25.69 | 25.69 | 25.69 | 25.69 | 25.69 |
| EBITAT | -1,141.5 | 1,870.6 | 2,035.2 | 2,523.9 | 3,361.1 | 3,067.0 | 3,834.7 | 4,794.5 | 5,994.6 | 7,495.2 |
| Depreciation | ||||||||||
| Changes in Account Receivables | ||||||||||
| Changes in Inventories | ||||||||||
| Changes in Accounts Payable | ||||||||||
| Capital Expenditure | ||||||||||
| UFCF | -1,417.3 | 1,549.2 | 1,600.2 | 2,084.9 | 3,176.8 | 2,141.3 | 3,310.4 | 4,139.0 | 5,175.1 | 6,470.4 |
| WACC, % | 4.64 | 4.66 | 4.66 | 4.66 | 4.66 | 4.66 | 4.66 | 4.66 | 4.66 | 4.66 |
| PV UFCF | ||||||||||
| SUM PV UFCF | 18,145.9 | |||||||||
| Long Term Growth Rate, % | 2.00 | |||||||||
| Free cash flow (T + 1) | 6,600 | |||||||||
| Terminal Value | 248,366 | |||||||||
| Present Terminal Value | 197,808 | |||||||||
| Enterprise Value | 215,954 | |||||||||
| Net Debt | 84 | |||||||||
| Equity Value | 215,871 | |||||||||
| Diluted Shares Outstanding, MM | 173 | |||||||||
| Equity Value Per Share | 1,250.60 |
What You Will Receive
- Customizable Excel Template: A fully editable Excel-based DCF Calculator featuring pre-filled financial data for KFin Technologies Limited (KFINTECHNS).
- Accurate Data Insights: Historical performance metrics and forward-looking projections (highlighted in the yellow cells).
- Flexible Forecasting: Adjust key assumptions such as revenue growth, EBITDA percentage, and WACC to suit your analysis.
- Instant Calculations: Quickly observe how changes in your inputs affect the valuation of KFin Technologies Limited (KFINTECHNS).
- Professional Resource: Designed for use by investors, CFOs, consultants, and financial analysts.
- Intuitive Layout: Organized for simplicity and efficiency, complete with step-by-step guidance.
Key Features
- Comprehensive DCF Calculator: Features detailed unlevered and levered DCF valuation models tailored for KFin Technologies Limited.
- WACC Calculator: Pre-configured Weighted Average Cost of Capital sheet with adjustable inputs specific to KFINTECHNS.
- Customizable Forecast Assumptions: Adjust variables like growth rates, capital expenditures, and discount rates as per your analysis needs.
- Integrated Financial Ratios: Assess profitability, leverage, and efficiency ratios relevant to KFin Technologies Limited (KFINTECHNS).
- User-Friendly Dashboard and Charts: Visual representations highlight essential valuation metrics for straightforward evaluation.
How It Works
- Step 1: Download the prebuilt Excel template featuring KFin Technologies Limited's data.
- Step 2: Navigate through the pre-filled sheets to familiarize yourself with the key performance indicators.
- Step 3: Modify forecasts and assumptions in the editable yellow cells (WACC, growth, margins).
- Step 4: Observe the updated results immediately, including KFin Technologies Limited’s intrinsic value.
- Step 5: Utilize the outputs to make well-informed investment decisions or create reports.
Reasons to Choose This Calculator for KFin Technologies Limited (KFINTECHNS)
- User-Friendly Interface: Tailored for both novices and seasoned users.
- Customizable Inputs: Easily adjust parameters to fit your financial analysis.
- Real-Time Valuation: Witness immediate updates to KFin's valuation as you change inputs.
- Preloaded Data: Comes with KFin Technologies' actual financial metrics for swift evaluations.
- Endorsed by Experts: Favored by investors and analysts for strategic decision-making.
Who Can Benefit from This Product?
- Finance Students: Master valuation methods and practice applying them with actual data.
- Academics: Integrate industry-standard models into your teaching or research efforts.
- Investors: Validate your hypotheses and evaluate valuation results for KFin Technologies Limited (KFINTECHNS).
- Analysts: Optimize your processes with a ready-to-use, customizable DCF model.
- Small Business Owners: Discover how major public companies like KFin Technologies Limited are assessed.
Contents of the Template
- Preloaded KFin Technologies Data: Historical and projected financial metrics, including revenue, EBIT, and capital expenditures.
- DCF and WACC Models: Advanced sheets designed for calculating intrinsic value and Weighted Average Cost of Capital.
- Editable Inputs: Yellow-highlighted cells for customizing revenue growth, tax rates, and discount rates.
- Financial Statements: Detailed annual and quarterly financials for comprehensive analysis.
- Key Ratios: Profitability, leverage, and efficiency ratios to assess performance.
- Dashboard and Charts: Visual representations of valuation results and underlying assumptions.
Disclaimer
All information, articles, and product details provided on this website are for general informational and educational purposes only. We do not claim any ownership over, nor do we intend to infringe upon, any trademarks, copyrights, logos, brand names, or other intellectual property mentioned or depicted on this site. Such intellectual property remains the property of its respective owners, and any references here are made solely for identification or informational purposes, without implying any affiliation, endorsement, or partnership.
We make no representations or warranties, express or implied, regarding the accuracy, completeness, or suitability of any content or products presented. Nothing on this website should be construed as legal, tax, investment, financial, medical, or other professional advice. In addition, no part of this site—including articles or product references—constitutes a solicitation, recommendation, endorsement, advertisement, or offer to buy or sell any securities, franchises, or other financial instruments, particularly in jurisdictions where such activity would be unlawful.
All content is of a general nature and may not address the specific circumstances of any individual or entity. It is not a substitute for professional advice or services. Any actions you take based on the information provided here are strictly at your own risk. You accept full responsibility for any decisions or outcomes arising from your use of this website and agree to release us from any liability in connection with your use of, or reliance upon, the content or products found herein.