
|
Kiocl Limited (Kiocl.NS) DCF -Bewertung |
Fully Editable: Tailor To Your Needs In Excel Or Sheets
Professional Design: Trusted, Industry-Standard Templates
Investor-Approved Valuation Models
MAC/PC Compatible, Fully Unlocked
No Expertise Is Needed; Easy To Follow
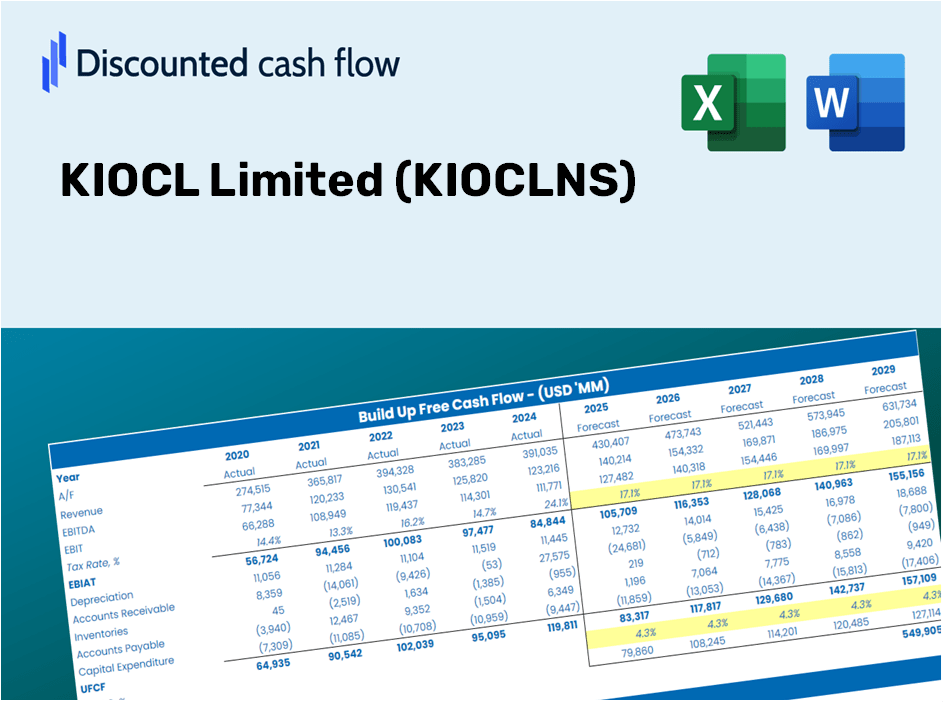
KIOCL Limited (KIOCL.NS) Bundle
Als Anleger oder Analyst ist der DCF-Taschenrechner von Kioc Limited (Kioclns) Ihre Anlaufstelle für eine genaue Bewertung. Mit echten Daten von Kiocl Limited können Sie problemlos die Prognosen anpassen und die Auswirkungen sofort beobachten.
Discounted Cash Flow (DCF) - (USD MM)
| Year | AY1 2021 |
AY2 2022 |
AY3 2023 |
AY4 2024 |
AY5 2025 |
FY1 2026 |
FY2 2027 |
FY3 2028 |
FY4 2029 |
FY5 2030 |
|---|---|---|---|---|---|---|---|---|---|---|
| Revenue | 23,613.6 | 30,062.1 | 15,432.1 | 18,540.7 | 5,905.2 | 4,881.2 | 4,034.7 | 3,335.1 | 2,756.7 | 2,278.7 |
| Revenue Growth, % | 0 | 27.31 | -48.67 | 20.14 | -68.15 | -17.34 | -17.34 | -17.34 | -17.34 | -17.34 |
| EBITDA | 4,483.6 | 4,530.5 | -837.3 | -217.0 | -1,503.1 | 19.6 | 16.2 | 13.4 | 11.1 | 9.2 |
| EBITDA, % | 18.99 | 15.07 | -5.43 | -1.17 | -25.45 | 0.40155 | 0.40155 | 0.40155 | 0.40155 | 0.40155 |
| Depreciation | 274.6 | 311.8 | 252.5 | 274.2 | 395.1 | 117.2 | 96.9 | 80.1 | 66.2 | 54.7 |
| Depreciation, % | 1.16 | 1.04 | 1.64 | 1.48 | 6.69 | 2.4 | 2.4 | 2.4 | 2.4 | 2.4 |
| EBIT | 4,209.0 | 4,218.7 | -1,089.9 | -491.2 | -1,898.2 | -97.6 | -80.7 | -66.7 | -55.1 | -45.6 |
| EBIT, % | 17.82 | 14.03 | -7.06 | -2.65 | -32.14 | -2 | -2 | -2 | -2 | -2 |
| Total Cash | 14,220.2 | 8,660.7 | 8,055.8 | 4,569.5 | 6,002.1 | 2,595.6 | 2,145.5 | 1,773.4 | 1,465.9 | 1,211.7 |
| Total Cash, percent | .0 | .0 | .0 | .0 | .0 | .0 | .0 | .0 | .0 | .0 |
| Account Receivables | 2,769.4 | 3,205.9 | 3,868.2 | 294.3 | 280.8 | 525.2 | 434.1 | 358.9 | 296.6 | 245.2 |
| Account Receivables, % | 11.73 | 10.66 | 25.07 | 1.59 | 4.76 | 10.76 | 10.76 | 10.76 | 10.76 | 10.76 |
| Inventories | 3,050.2 | 3,457.5 | 3,331.8 | 4,640.7 | 1,192.1 | 890.6 | 736.1 | 608.5 | 503.0 | 415.7 |
| Inventories, % | 12.92 | 11.5 | 21.59 | 25.03 | 20.19 | 18.24 | 18.24 | 18.24 | 18.24 | 18.24 |
| Accounts Payable | 1,463.1 | 1,335.1 | 1,648.5 | 1,285.7 | 2,003.1 | 607.0 | 501.7 | 414.7 | 342.8 | 283.4 |
| Accounts Payable, % | 6.2 | 4.44 | 10.68 | 6.93 | 33.92 | 12.44 | 12.44 | 12.44 | 12.44 | 12.44 |
| Capital Expenditure | -410.5 | -2,904.5 | -4,233.2 | -1,099.1 | -273.4 | -482.1 | -398.5 | -329.4 | -272.3 | -225.1 |
| Capital Expenditure, % | -1.74 | -9.66 | -27.43 | -5.93 | -4.63 | -9.88 | -9.88 | -9.88 | -9.88 | -9.88 |
| Tax Rate, % | 0.23894 | 0.23894 | 0.23894 | 0.23894 | 0.23894 | 0.23894 | 0.23894 | 0.23894 | 0.23894 | 0.23894 |
| EBITAT | 3,090.0 | 3,216.7 | -867.1 | -642.4 | -1,893.7 | -83.7 | -69.2 | -57.2 | -47.3 | -39.1 |
| Depreciation | ||||||||||
| Changes in Account Receivables | ||||||||||
| Changes in Inventories | ||||||||||
| Changes in Accounts Payable | ||||||||||
| Capital Expenditure | ||||||||||
| UFCF | -1,402.5 | -347.7 | -5,071.0 | 434.9 | 2,407.6 | -1,787.8 | -230.6 | -190.6 | -157.6 | -130.2 |
| WACC, % | 6.63 | 6.63 | 6.63 | 6.64 | 6.64 | 6.63 | 6.63 | 6.63 | 6.63 | 6.63 |
| PV UFCF | ||||||||||
| SUM PV UFCF | -2,252.9 | |||||||||
| Long Term Growth Rate, % | 4.00 | |||||||||
| Free cash flow (T + 1) | -135 | |||||||||
| Terminal Value | -5,142 | |||||||||
| Present Terminal Value | -3,729 | |||||||||
| Enterprise Value | -5,982 | |||||||||
| Net Debt | -5,365 | |||||||||
| Equity Value | -617 | |||||||||
| Diluted Shares Outstanding, MM | 608 | |||||||||
| Equity Value Per Share | -1.02 |
What You Will Receive
- Real KIOCL Financial Data: Preloaded with KIOCL Limited’s historical and projected financial figures for accurate analysis.
- Fully Customizable Template: Easily adjust key inputs such as revenue growth, WACC, and EBITDA margins.
- Instant Calculations: Watch KIOCL's intrinsic value update automatically as you make changes.
- Professional Valuation Tool: Tailored for investors, analysts, and consultants aiming for precise DCF evaluations.
- User-Friendly Interface: Streamlined layout and straightforward instructions suitable for all skill levels.
Key Features
- Comprehensive DCF Calculator: Offers detailed unlevered and levered DCF valuation models tailored for KIOCL Limited (KIOCLNS).
- WACC Calculation Tool: Pre-configured Weighted Average Cost of Capital sheet with the option to customize inputs.
- Adjustable Forecast Parameters: Easily modify growth rates, capital expenditures, and discount rates specific to KIOCL Limited (KIOCLNS).
- Integrated Financial Ratios: Evaluate profitability, leverage, and efficiency ratios relevant to KIOCL Limited (KIOCLNS).
- User-Friendly Dashboard and Charts: Visual presentations of essential valuation metrics for straightforward analysis.
How It Operates
- Download: Obtain the pre-configured Excel file containing KIOCL Limited's financial data.
- Customize: Modify key assumptions such as revenue growth, EBITDA %, and WACC.
- Update Instantly: The intrinsic value and NPV calculations refresh automatically in real-time.
- Analyze Scenarios: Develop various projections and assess results immediately.
- Make Informed Decisions: Leverage the valuation insights to inform your investment strategy.
Why Choose KIOCL Limited ([KIOCLNS])?
- Save Time: Skip the hassle of building a model from the ground up – it's fully prepared for you.
- Enhance Accuracy: Dependable financial data and calculations minimize valuation errors.
- Completely Customizable: Adjust the model to match your specific assumptions and forecasts.
- Simple to Understand: Intuitive charts and outputs facilitate easy analysis of results.
- Endorsed by Experts: Crafted for professionals who prioritize precision and functionality.
Who Can Benefit from This Product?
- Professional Investors: Create comprehensive and trustworthy valuation models for assessing portfolios related to KIOCL Limited (KIOCLNS).
- Corporate Finance Teams: Evaluate valuation scenarios to inform internal decision-making for KIOCL Limited (KIOCLNS).
- Consultants and Advisors: Offer clients precise valuation insights on KIOCL Limited (KIOCLNS).
- Students and Educators: Utilize real-world data to learn and teach financial modeling with a focus on KIOCL Limited (KIOCLNS).
- Industry Enthusiasts: Gain insights into how companies like KIOCL Limited (KIOCLNS) are valued in the market.
Contents of the Template
- Preloaded KIOCL Data: Historical and projected financial metrics, including revenue, EBIT, and capital expenditures.
- DCF and WACC Models: Professional-level spreadsheets designed for calculating intrinsic value and Weighted Average Cost of Capital.
- Editable Inputs: Yellow-highlighted cells for modifying revenue growth, tax rates, and discount rates.
- Financial Statements: Detailed annual and quarterly financial reports for in-depth analysis.
- Key Ratios: Metrics on profitability, leverage, and efficiency to assess performance.
- Dashboard and Charts: Visual representations of valuation outcomes and underlying assumptions.
Disclaimer
All information, articles, and product details provided on this website are for general informational and educational purposes only. We do not claim any ownership over, nor do we intend to infringe upon, any trademarks, copyrights, logos, brand names, or other intellectual property mentioned or depicted on this site. Such intellectual property remains the property of its respective owners, and any references here are made solely for identification or informational purposes, without implying any affiliation, endorsement, or partnership.
We make no representations or warranties, express or implied, regarding the accuracy, completeness, or suitability of any content or products presented. Nothing on this website should be construed as legal, tax, investment, financial, medical, or other professional advice. In addition, no part of this site—including articles or product references—constitutes a solicitation, recommendation, endorsement, advertisement, or offer to buy or sell any securities, franchises, or other financial instruments, particularly in jurisdictions where such activity would be unlawful.
All content is of a general nature and may not address the specific circumstances of any individual or entity. It is not a substitute for professional advice or services. Any actions you take based on the information provided here are strictly at your own risk. You accept full responsibility for any decisions or outcomes arising from your use of this website and agree to release us from any liability in connection with your use of, or reliance upon, the content or products found herein.