
|
KLA Corporation (KLAC) DCF -Bewertung |
Fully Editable: Tailor To Your Needs In Excel Or Sheets
Professional Design: Trusted, Industry-Standard Templates
Investor-Approved Valuation Models
MAC/PC Compatible, Fully Unlocked
No Expertise Is Needed; Easy To Follow
KLA Corporation (KLAC) Bundle
Vereinfachen Sie die Bewertung der KLA Corporation (KLAC) mit diesem anpassbaren DCF -Taschenrechner! Mit Real KLA Corporation (KLAC) -Fonds und einstellbaren Prognoseeingaben können Sie Szenarien testen und die Fair -Wert der KLA Corporation (KLAC) in Minuten aufdecken.
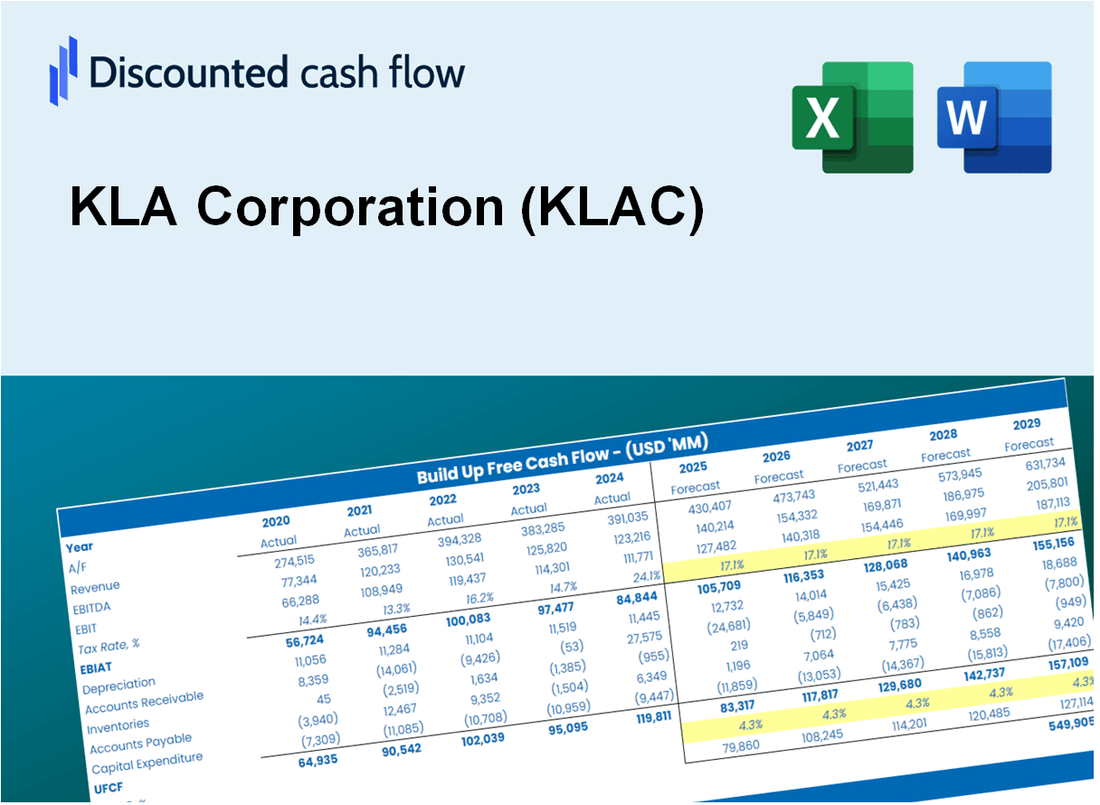
Discounted Cash Flow (DCF) - (USD MM)
| Year | AY1 2021 |
AY2 2022 |
AY3 2023 |
AY4 2024 |
AY5 2025 |
FY1 2026 |
FY2 2027 |
FY3 2028 |
FY4 2029 |
FY5 2030 |
|---|---|---|---|---|---|---|---|---|---|---|
| Revenue | 6,918.7 | 9,211.9 | 10,496.1 | 9,812.2 | 12,156.2 | 14,115.0 | 16,389.6 | 19,030.6 | 22,097.3 | 25,658.1 |
| Revenue Growth, % | 0 | 33.14 | 13.94 | -6.51 | 23.89 | 16.11 | 16.11 | 16.11 | 16.11 | 16.11 |
| EBITDA | 2,851.1 | 4,012.9 | 4,501.2 | 3,906.8 | 5,340.7 | 5,968.0 | 6,929.7 | 8,046.4 | 9,343.0 | 10,848.5 |
| EBITDA, % | 41.21 | 43.56 | 42.89 | 39.82 | 43.93 | 42.28 | 42.28 | 42.28 | 42.28 | 42.28 |
| Depreciation | 333.3 | 363.3 | 415.1 | 401.7 | 394.1 | 566.1 | 657.3 | 763.2 | 886.2 | 1,029.1 |
| Depreciation, % | 4.82 | 3.94 | 3.95 | 4.09 | 3.24 | 4.01 | 4.01 | 4.01 | 4.01 | 4.01 |
| EBIT | 2,517.8 | 3,649.6 | 4,086.1 | 3,505.0 | 4,946.6 | 5,401.9 | 6,272.4 | 7,283.1 | 8,456.7 | 9,819.5 |
| EBIT, % | 36.39 | 39.62 | 38.93 | 35.72 | 40.69 | 38.27 | 38.27 | 38.27 | 38.27 | 38.27 |
| Total Cash | 2,494.5 | 2,708.0 | 3,243.2 | 4,504.0 | 4,494.6 | 5,059.6 | 5,874.9 | 6,821.6 | 7,920.8 | 9,197.2 |
| Total Cash, percent | .0 | .0 | .0 | .0 | .0 | .0 | .0 | .0 | .0 | .0 |
| Account Receivables | 1,465.4 | 2,016.3 | 1,935.4 | 2,004.7 | 2,433.7 | 2,878.3 | 3,342.1 | 3,880.7 | 4,506.0 | 5,232.1 |
| Account Receivables, % | 21.18 | 21.89 | 18.44 | 20.43 | 20.02 | 20.39 | 20.39 | 20.39 | 20.39 | 20.39 |
| Inventories | 1,575.4 | 2,146.9 | 2,876.8 | 3,034.8 | 3,212.1 | 3,693.5 | 4,288.7 | 4,979.8 | 5,782.3 | 6,714.0 |
| Inventories, % | 22.77 | 23.31 | 27.41 | 30.93 | 26.42 | 26.17 | 26.17 | 26.17 | 26.17 | 26.17 |
| Accounts Payable | 342.1 | 443.3 | 371.0 | 359.5 | 458.5 | 585.1 | 679.4 | 788.9 | 916.0 | 1,063.7 |
| Accounts Payable, % | 4.94 | 4.81 | 3.53 | 3.66 | 3.77 | 4.15 | 4.15 | 4.15 | 4.15 | 4.15 |
| Capital Expenditure | -231.6 | -307.3 | -341.6 | -277.4 | -340.2 | -439.4 | -510.2 | -592.4 | -687.8 | -798.7 |
| Capital Expenditure, % | -3.35 | -3.34 | -3.25 | -2.83 | -2.8 | -3.11 | -3.11 | -3.11 | -3.11 | -3.11 |
| Tax Rate, % | 12.55 | 12.55 | 12.55 | 12.55 | 12.55 | 12.55 | 12.55 | 12.55 | 12.55 | 12.55 |
| EBITAT | 2,216.8 | 3,474.5 | 3,652.7 | 3,034.6 | 4,325.9 | 4,825.7 | 5,603.4 | 6,506.3 | 7,554.8 | 8,772.2 |
| Depreciation | ||||||||||
| Changes in Account Receivables | ||||||||||
| Changes in Inventories | ||||||||||
| Changes in Accounts Payable | ||||||||||
| Capital Expenditure | ||||||||||
| UFCF | -380.2 | 2,509.3 | 3,005.0 | 2,920.1 | 3,872.4 | 4,153.1 | 4,785.8 | 5,557.0 | 6,452.5 | 7,492.3 |
| WACC, % | 10.55 | 10.56 | 10.55 | 10.54 | 10.54 | 10.55 | 10.55 | 10.55 | 10.55 | 10.55 |
| PV UFCF | ||||||||||
| SUM PV UFCF | 20,644.9 | |||||||||
| Long Term Growth Rate, % | 4.00 | |||||||||
| Free cash flow (T + 1) | 7,792 | |||||||||
| Terminal Value | 119,008 | |||||||||
| Present Terminal Value | 72,083 | |||||||||
| Enterprise Value | 92,728 | |||||||||
| Net Debt | 4,009 | |||||||||
| Equity Value | 88,719 | |||||||||
| Diluted Shares Outstanding, MM | 134 | |||||||||
| Equity Value Per Share | 663.32 |
What You Will Get
- Real KLA Data: Preloaded financials – from revenue to EBIT – based on actual and projected figures.
- Full Customization: Adjust all critical parameters (yellow cells) like WACC, growth %, and tax rates.
- Instant Valuation Updates: Automatic recalculations to analyze the impact of changes on KLA Corporation’s fair value.
- Versatile Excel Template: Tailored for quick edits, scenario testing, and detailed projections.
- Time-Saving and Accurate: Skip building models from scratch while maintaining precision and flexibility.
Key Features
- Customizable Forecast Inputs: Adjust essential parameters such as revenue growth, EBITDA %, and capital expenditures tailored for KLA Corporation (KLAC).
- Instant DCF Valuation: Quickly computes intrinsic value, NPV, and additional outputs relevant to KLA Corporation (KLAC).
- High-Precision Accuracy: Leverages KLA Corporation’s (KLAC) actual financial data for dependable valuation results.
- Effortless Scenario Analysis: Easily evaluate various assumptions and analyze different outcomes for KLA Corporation (KLAC).
- Efficiency Booster: Streamline the valuation process without the hassle of creating intricate models from scratch for KLA Corporation (KLAC).
How It Works
- Step 1: Download the Excel file.
- Step 2: Review pre-entered KLA Corporation (KLAC) data (historical and projected).
- Step 3: Adjust key assumptions (yellow cells) based on your analysis.
- Step 4: View automatic recalculations for KLA Corporation’s intrinsic value.
- Step 5: Use the outputs for investment decisions or reporting.
Why Choose This Calculator for KLA Corporation (KLAC)?
- Comprehensive Tool: Incorporates DCF, WACC, and financial ratio analyses tailored for KLA Corporation.
- Customizable Inputs: Modify yellow-highlighted cells to explore various financial scenarios for (KLAC).
- Detailed Insights: Automatically computes KLA Corporation’s intrinsic value and Net Present Value.
- Preloaded Data: Historical and forecasted data provide reliable starting points for analysis.
- Professional Quality: Perfect for financial analysts, investors, and business consultants focusing on (KLAC).
Who Should Use This Product?
- Investors: Assess KLA Corporation’s valuation before making stock transactions.
- CFOs and Financial Analysts: Optimize valuation methodologies and evaluate financial forecasts.
- Startup Founders: Understand the valuation processes of leading tech companies like KLA Corporation.
- Consultants: Provide comprehensive valuation reports for your clients focused on KLA Corporation.
- Students and Educators: Utilize current data to practice and instruct on valuation strategies.
What the Template Contains
- Pre-Filled Data: Includes KLA Corporation's historical financials and forecasts.
- Discounted Cash Flow Model: Editable DCF valuation model with automatic calculations.
- Weighted Average Cost of Capital (WACC): A dedicated sheet for calculating WACC based on custom inputs.
- Key Financial Ratios: Analyze KLA Corporation's profitability, efficiency, and leverage.
- Customizable Inputs: Edit revenue growth, margins, and tax rates with ease.
- Clear Dashboard: Charts and tables summarizing key valuation results.
Disclaimer
All information, articles, and product details provided on this website are for general informational and educational purposes only. We do not claim any ownership over, nor do we intend to infringe upon, any trademarks, copyrights, logos, brand names, or other intellectual property mentioned or depicted on this site. Such intellectual property remains the property of its respective owners, and any references here are made solely for identification or informational purposes, without implying any affiliation, endorsement, or partnership.
We make no representations or warranties, express or implied, regarding the accuracy, completeness, or suitability of any content or products presented. Nothing on this website should be construed as legal, tax, investment, financial, medical, or other professional advice. In addition, no part of this site—including articles or product references—constitutes a solicitation, recommendation, endorsement, advertisement, or offer to buy or sell any securities, franchises, or other financial instruments, particularly in jurisdictions where such activity would be unlawful.
All content is of a general nature and may not address the specific circumstances of any individual or entity. It is not a substitute for professional advice or services. Any actions you take based on the information provided here are strictly at your own risk. You accept full responsibility for any decisions or outcomes arising from your use of this website and agree to release us from any liability in connection with your use of, or reliance upon, the content or products found herein.