
|
Keller Group Plc (KLR.L) DCF -Bewertung |
Fully Editable: Tailor To Your Needs In Excel Or Sheets
Professional Design: Trusted, Industry-Standard Templates
Investor-Approved Valuation Models
MAC/PC Compatible, Fully Unlocked
No Expertise Is Needed; Easy To Follow
Keller Group plc (KLR.L) Bundle
Bewerten Sie die finanziellen Aussichten von Keller Group Plc wie ein Experte! Dieser (KLRL) DCF-Taschenrechner bietet vorgefüllte Finanzdaten und vollständige Flexibilität, um das Umsatzwachstum, WACC, Margen und andere wesentliche Annahmen zu ändern, um sich an Ihren Projektionen auszurichten.
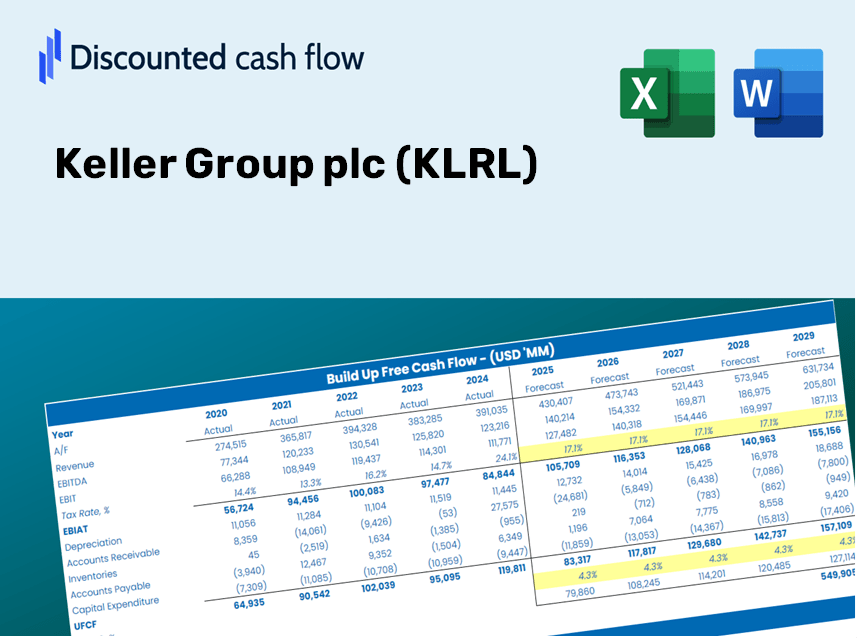
Discounted Cash Flow (DCF) - (USD MM)
| Year | AY1 2020 |
AY2 2021 |
AY3 2022 |
AY4 2023 |
AY5 2024 |
FY1 2025 |
FY2 2026 |
FY3 2027 |
FY4 2028 |
FY5 2029 |
|---|---|---|---|---|---|---|---|---|---|---|
| Revenue | 2,062.5 | 2,224.4 | 2,944.6 | 2,966.0 | 2,986.7 | 3,297.7 | 3,641.1 | 4,020.2 | 4,438.9 | 4,901.1 |
| Revenue Growth, % | 0 | 7.85 | 32.38 | 0.72675 | 0.69791 | 10.41 | 10.41 | 10.41 | 10.41 | 10.41 |
| EBITDA | 192.5 | 178.6 | 182.9 | 272.2 | 289.3 | 279.9 | 309.0 | 341.2 | 376.7 | 416.0 |
| EBITDA, % | 9.33 | 8.03 | 6.21 | 9.18 | 9.69 | 8.49 | 8.49 | 8.49 | 8.49 | 8.49 |
| Depreciation | 99.1 | 93.8 | 111.6 | 116.7 | 82.2 | 128.6 | 142.0 | 156.8 | 173.1 | 191.1 |
| Depreciation, % | 4.8 | 4.22 | 3.79 | 3.93 | 2.75 | 3.9 | 3.9 | 3.9 | 3.9 | 3.9 |
| EBIT | 93.4 | 84.8 | 71.3 | 155.5 | 207.1 | 151.3 | 167.0 | 184.4 | 203.6 | 224.9 |
| EBIT, % | 4.53 | 3.81 | 2.42 | 5.24 | 6.93 | 4.59 | 4.59 | 4.59 | 4.59 | 4.59 |
| Total Cash | 66.3 | 82.7 | 101.1 | 151.4 | 202.7 | 146.8 | 162.1 | 179.0 | 197.6 | 218.2 |
| Total Cash, percent | .0 | .0 | .0 | .0 | .0 | .0 | .0 | .0 | .0 | .0 |
| Account Receivables | 486.8 | 574.8 | 746.5 | 674.0 | 718.0 | 801.7 | 885.2 | 977.4 | 1,079.2 | 1,191.5 |
| Account Receivables, % | 23.6 | 25.84 | 25.35 | 22.72 | 24.04 | 24.31 | 24.31 | 24.31 | 24.31 | 24.31 |
| Inventories | 60.1 | 72.1 | 124.4 | 93.3 | 81.6 | 107.2 | 118.4 | 130.7 | 144.3 | 159.4 |
| Inventories, % | 2.91 | 3.24 | 4.22 | 3.15 | 2.73 | 3.25 | 3.25 | 3.25 | 3.25 | 3.25 |
| Accounts Payable | 381.9 | 268.8 | 229.4 | 155.5 | 168.0 | 324.9 | 358.7 | 396.1 | 437.3 | 482.8 |
| Accounts Payable, % | 18.52 | 12.08 | 7.79 | 5.24 | 5.62 | 9.85 | 9.85 | 9.85 | 9.85 | 9.85 |
| Capital Expenditure | -73.0 | -84.4 | -81.7 | -94.3 | -89.0 | -107.3 | -118.5 | -130.8 | -144.4 | -159.5 |
| Capital Expenditure, % | -3.54 | -3.79 | -2.77 | -3.18 | -2.98 | -3.25 | -3.25 | -3.25 | -3.25 | -3.25 |
| Tax Rate, % | 22.62 | 22.62 | 22.62 | 22.62 | 22.62 | 22.62 | 22.62 | 22.62 | 22.62 | 22.62 |
| EBITAT | 62.2 | 71.0 | 58.3 | 110.7 | 160.3 | 115.2 | 127.1 | 140.4 | 155.0 | 171.1 |
| Depreciation | ||||||||||
| Changes in Account Receivables | ||||||||||
| Changes in Inventories | ||||||||||
| Changes in Accounts Payable | ||||||||||
| Capital Expenditure | ||||||||||
| UFCF | -76.7 | -132.7 | -175.2 | 162.8 | 133.7 | 184.0 | 89.9 | 99.2 | 109.5 | 121.0 |
| WACC, % | 7.8 | 8.11 | 8.07 | 7.88 | 7.99 | 7.97 | 7.97 | 7.97 | 7.97 | 7.97 |
| PV UFCF | ||||||||||
| SUM PV UFCF | 489.4 | |||||||||
| Long Term Growth Rate, % | 2.00 | |||||||||
| Free cash flow (T + 1) | 123 | |||||||||
| Terminal Value | 2,067 | |||||||||
| Present Terminal Value | 1,409 | |||||||||
| Enterprise Value | 1,898 | |||||||||
| Net Debt | 132 | |||||||||
| Equity Value | 1,766 | |||||||||
| Diluted Shares Outstanding, MM | 74 | |||||||||
| Equity Value Per Share | 2,399.75 |
What You Will Receive
- Authentic Keller Data: Preloaded financial metrics – encompassing everything from revenue to EBIT – derived from actual and forecasted figures.
- Comprehensive Customization: Modify all key parameters (yellow cells) such as WACC, growth %, and tax rates.
- Immediate Valuation Adjustments: Automatic recalculations to assess the effects of changes on Keller’s fair value.
- Flexible Excel Template: Designed for quick modifications, scenario analysis, and in-depth forecasting.
- Efficient and Precise: Eliminate the need to construct models from the ground up while ensuring accuracy and adaptability.
Key Features
- Comprehensive DCF Calculator: Features detailed unlevered and levered DCF valuation models tailored for Keller Group plc (KLRL).
- WACC Calculator: Comes equipped with a pre-built Weighted Average Cost of Capital sheet, offering customizable input options.
- Adjustable Forecast Assumptions: Easily modify growth estimates, capital expenditures, and discount rates to suit your analysis.
- Integrated Financial Ratios: Evaluate profitability, leverage, and efficiency ratios specific to Keller Group plc (KLRL).
- Visual Dashboard and Charts: Convenient visual outputs that encapsulate key valuation metrics for straightforward analysis.
How It Works
- Step 1: Download the Excel file.
- Step 2: Review the pre-populated data for Keller Group plc (KLRL), including historical and projected figures.
- Step 3: Modify the key assumptions (highlighted in yellow) according to your own analysis.
- Step 4: Observe the automatic recalculations for Keller Group plc's (KLRL) intrinsic value.
- Step 5: Utilize the results for your investment decisions or reporting needs.
Why Choose This Calculator for Keller Group plc (KLRL)?
- Accurate Data: Access reliable financial metrics specific to Keller Group plc for trustworthy valuation insights.
- Customizable: Tailor essential variables like growth rates, WACC, and tax rates to align with your forecasts.
- Time-Saving: Utilize pre-configured calculations to streamline your analysis process.
- Professional-Grade Tool: Built for investors, analysts, and consultants focusing on Keller Group plc (KLRL).
- User-Friendly: An intuitive design and guided instructions ensure ease of use for everyone.
Who Can Benefit from This Product?
- Finance Students: Master valuation methods and practice with actual data.
- Academics: Integrate industry-standard models into your teaching or research projects.
- Investors: Validate your hypotheses and assess valuation scenarios for Keller Group plc (KLRL).
- Analysts: Enhance your efficiency with a ready-to-use, adaptable DCF model.
- Small Business Owners: Learn how major public companies like Keller Group plc (KLRL) are evaluated.
Contents of the Template
- Comprehensive DCF Model: An editable template featuring intricate valuation calculations.
- Real-World Data: Historical and projected financials of Keller Group plc (KLRL) preloaded for analysis.
- Customizable Parameters: Modify WACC, growth rates, and tax assumptions to explore various scenarios.
- Financial Statements: Detailed annual and quarterly breakdowns for enhanced insights.
- Key Ratios: Integrated analysis tools for assessing profitability, efficiency, and leverage.
- Dashboard with Visual Outputs: Charts and tables designed for clear, actionable results.
Disclaimer
All information, articles, and product details provided on this website are for general informational and educational purposes only. We do not claim any ownership over, nor do we intend to infringe upon, any trademarks, copyrights, logos, brand names, or other intellectual property mentioned or depicted on this site. Such intellectual property remains the property of its respective owners, and any references here are made solely for identification or informational purposes, without implying any affiliation, endorsement, or partnership.
We make no representations or warranties, express or implied, regarding the accuracy, completeness, or suitability of any content or products presented. Nothing on this website should be construed as legal, tax, investment, financial, medical, or other professional advice. In addition, no part of this site—including articles or product references—constitutes a solicitation, recommendation, endorsement, advertisement, or offer to buy or sell any securities, franchises, or other financial instruments, particularly in jurisdictions where such activity would be unlawful.
All content is of a general nature and may not address the specific circumstances of any individual or entity. It is not a substitute for professional advice or services. Any actions you take based on the information provided here are strictly at your own risk. You accept full responsibility for any decisions or outcomes arising from your use of this website and agree to release us from any liability in connection with your use of, or reliance upon, the content or products found herein.