
|
Kimberly-Clark Corporation (KMB) DCF-Bewertung |
Fully Editable: Tailor To Your Needs In Excel Or Sheets
Professional Design: Trusted, Industry-Standard Templates
Investor-Approved Valuation Models
MAC/PC Compatible, Fully Unlocked
No Expertise Is Needed; Easy To Follow
Kimberly-Clark Corporation (KMB) Bundle
Gewinnen Sie einen Einblick in Ihre Kimberly-Clark Corporation-Bewertungsanalyse (KMB) mit unserem hochmodernen DCF-Taschenrechner! Diese Excel-Vorlage wird mit realen (KMB-) Daten vorinstalliert, sodass Sie Prognosen und Annahmen für eine genaue Berechnung des inneren Werts von Kimberly-Clark anpassen können.
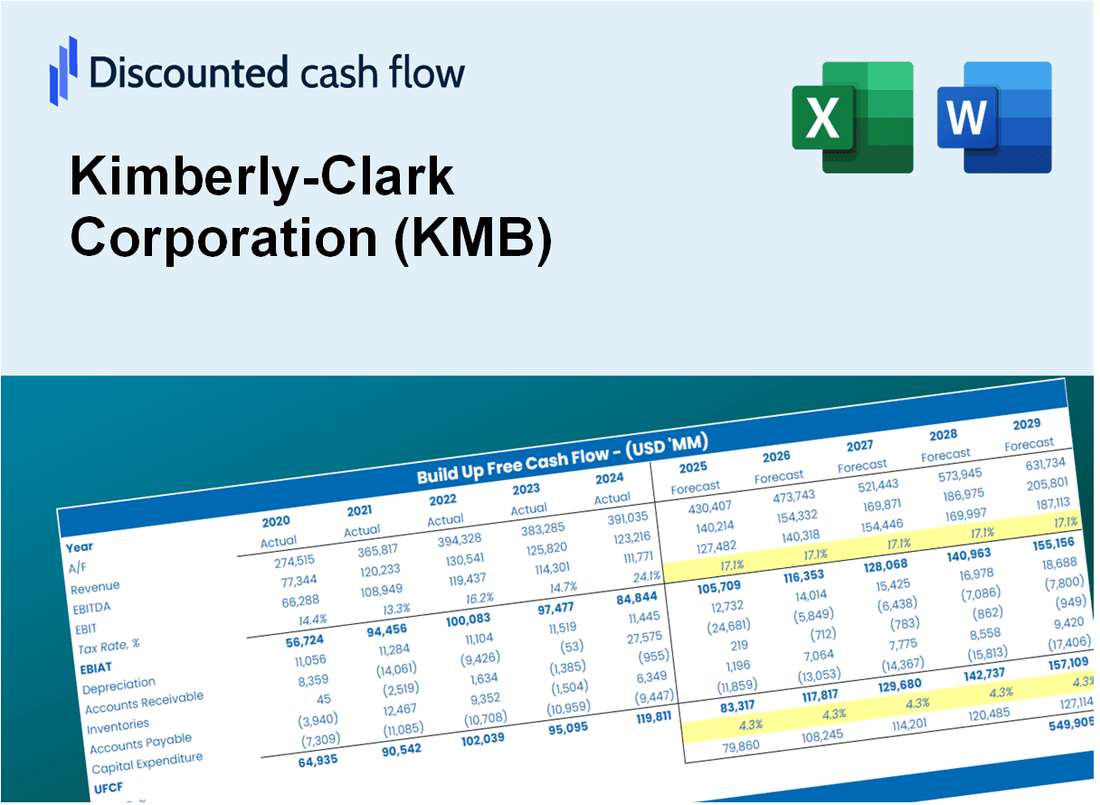
Discounted Cash Flow (DCF) - (USD MM)
| Year | AY1 2020 |
AY2 2021 |
AY3 2022 |
AY4 2023 |
AY5 2024 |
FY1 2025 |
FY2 2026 |
FY3 2027 |
FY4 2028 |
FY5 2029 |
|---|---|---|---|---|---|---|---|---|---|---|
| Revenue | 19,140.0 | 19,440.0 | 20,175.0 | 20,431.0 | 20,058.0 | 20,298.3 | 20,541.4 | 20,787.5 | 21,036.5 | 21,288.5 |
| Revenue Growth, % | 0 | 1.57 | 3.78 | 1.27 | -1.83 | 1.2 | 1.2 | 1.2 | 1.2 | 1.2 |
| EBITDA | 3,978.0 | 3,247.0 | 3,376.0 | 3,067.0 | 3,978.0 | 3,615.7 | 3,659.0 | 3,702.8 | 3,747.2 | 3,792.1 |
| EBITDA, % | 20.78 | 16.7 | 16.73 | 15.01 | 19.83 | 17.81 | 17.81 | 17.81 | 17.81 | 17.81 |
| Depreciation | 796.0 | 766.0 | 754.0 | 753.0 | 781.0 | 788.2 | 797.7 | 807.2 | 816.9 | 826.7 |
| Depreciation, % | 4.16 | 3.94 | 3.74 | 3.69 | 3.89 | 3.88 | 3.88 | 3.88 | 3.88 | 3.88 |
| EBIT | 3,182.0 | 2,481.0 | 2,622.0 | 2,314.0 | 3,197.0 | 2,827.5 | 2,861.3 | 2,895.6 | 2,930.3 | 2,965.4 |
| EBIT, % | 16.62 | 12.76 | 13 | 11.33 | 15.94 | 13.93 | 13.93 | 13.93 | 13.93 | 13.93 |
| Total Cash | 303.0 | 270.0 | 427.0 | 1,093.0 | 1,021.0 | 630.4 | 638.0 | 645.6 | 653.3 | 661.2 |
| Total Cash, percent | .0 | .0 | .0 | .0 | .0 | .0 | .0 | .0 | .0 | .0 |
| Account Receivables | 2,235.0 | 2,207.0 | 2,280.0 | 2,135.0 | 2,009.0 | 2,224.6 | 2,251.2 | 2,278.2 | 2,305.5 | 2,333.1 |
| Account Receivables, % | 11.68 | 11.35 | 11.3 | 10.45 | 10.02 | 10.96 | 10.96 | 10.96 | 10.96 | 10.96 |
| Inventories | 1,903.0 | 2,239.0 | 2,269.0 | 1,955.0 | 1,822.0 | 2,085.0 | 2,110.0 | 2,135.3 | 2,160.8 | 2,186.7 |
| Inventories, % | 9.94 | 11.52 | 11.25 | 9.57 | 9.08 | 10.27 | 10.27 | 10.27 | 10.27 | 10.27 |
| Accounts Payable | 3,336.0 | 3,840.0 | 3,813.0 | 3,653.0 | 3,715.0 | 3,754.5 | 3,799.5 | 3,845.0 | 3,891.0 | 3,937.7 |
| Accounts Payable, % | 17.43 | 19.75 | 18.9 | 17.88 | 18.52 | 18.5 | 18.5 | 18.5 | 18.5 | 18.5 |
| Capital Expenditure | -1,217.0 | -1,007.0 | -876.0 | -766.0 | -721.0 | -942.8 | -954.1 | -965.5 | -977.1 | -988.8 |
| Capital Expenditure, % | -6.36 | -5.18 | -4.34 | -3.75 | -3.59 | -4.64 | -4.64 | -4.64 | -4.64 | -4.64 |
| Tax Rate, % | 13.05 | 13.05 | 13.05 | 13.05 | 13.05 | 13.05 | 13.05 | 13.05 | 13.05 | 13.05 |
| EBITAT | 2,554.3 | 2,022.7 | 2,167.1 | 2,019.7 | 2,779.8 | 2,367.6 | 2,396.0 | 2,424.7 | 2,453.7 | 2,483.1 |
| Depreciation | ||||||||||
| Changes in Account Receivables | ||||||||||
| Changes in Inventories | ||||||||||
| Changes in Accounts Payable | ||||||||||
| Capital Expenditure | ||||||||||
| UFCF | 1,331.3 | 1,977.7 | 1,915.1 | 2,305.7 | 3,160.8 | 1,774.0 | 2,232.9 | 2,259.6 | 2,286.7 | 2,314.1 |
| WACC, % | 4.8 | 4.8 | 4.81 | 4.84 | 4.84 | 4.82 | 4.82 | 4.82 | 4.82 | 4.82 |
| PV UFCF | ||||||||||
| SUM PV UFCF | 9,410.1 | |||||||||
| Long Term Growth Rate, % | 3.00 | |||||||||
| Free cash flow (T + 1) | 2,384 | |||||||||
| Terminal Value | 131,075 | |||||||||
| Present Terminal Value | 103,594 | |||||||||
| Enterprise Value | 113,004 | |||||||||
| Net Debt | 6,895 | |||||||||
| Equity Value | 106,109 | |||||||||
| Diluted Shares Outstanding, MM | 337 | |||||||||
| Equity Value Per Share | 314.86 |
What You Will Receive
- Adjustable Forecast Inputs: Modify key assumptions (growth %, margins, WACC) to generate various scenarios.
- Comprehensive Data: Kimberly-Clark Corporation’s (KMB) financial data pre-loaded to facilitate your analysis.
- Instant DCF Outputs: The template computes Net Present Value (NPV) and intrinsic value automatically.
- Tailored and Professional: A sleek Excel model that caters to your valuation requirements.
- Designed for Analysts and Investors: Perfect for evaluating projections, confirming strategies, and enhancing efficiency.
Key Features
- Comprehensive Financial Data: Kimberly-Clark's historical financial statements and pre-filled projections.
- Customizable Assumptions: Modify WACC, tax rates, revenue growth, and EBITDA margins as needed.
- Real-Time Valuation: Observe Kimberly-Clark's intrinsic value recalculating instantly.
- Intuitive Visualizations: Dashboard graphs illustrate valuation outcomes and essential metrics clearly.
- Designed for Precision: A professional-grade tool tailored for analysts, investors, and finance professionals.
How It Works
- Download: Obtain the pre-prepared Excel file containing Kimberly-Clark Corporation’s (KMB) financial data.
- Customize: Modify forecasts, such as revenue growth, EBITDA %, and WACC according to your analysis.
- Update Automatically: The intrinsic value and NPV calculations refresh in real-time as you make changes.
- Test Scenarios: Generate various projections and instantly compare the results.
- Make Decisions: Leverage the valuation outcomes to inform your investment choices.
Why Choose Kimberly-Clark Corporation (KMB)?
- Commitment to Quality: Renowned for delivering high-quality products that meet consumer needs.
- Innovative Solutions: Continually develops new products to enhance everyday life.
- Sustainability Focus: Dedicated to environmentally friendly practices and sustainable sourcing.
- Global Reach: Operates in numerous countries, providing trusted brands worldwide.
- Strong Financial Performance: Proven track record of delivering value to shareholders.
Who Should Use Kimberly-Clark Corporation (KMB)?
- Investors: Gain insights into consumer goods investments with a trusted brand in the market.
- Financial Analysts: Utilize comprehensive data to enhance your analysis of market trends and performance.
- Consultants: Tailor presentations for clients by leveraging Kimberly-Clark's extensive portfolio of products.
- Business Students: Explore case studies and real-world applications of business strategies in the consumer goods sector.
- Industry Researchers: Access valuable information for in-depth studies on market dynamics and consumer behavior.
What the Template Contains
- Historical Data: Includes Kimberly-Clark’s past financials and baseline forecasts.
- DCF and Levered DCF Models: Detailed templates to calculate Kimberly-Clark’s intrinsic value.
- WACC Sheet: Pre-built calculations for Weighted Average Cost of Capital.
- Editable Inputs: Modify key drivers like growth rates, EBITDA %, and CAPEX assumptions.
- Quarterly and Annual Statements: A complete breakdown of Kimberly-Clark’s financials.
- Interactive Dashboard: Visualize valuation results and projections dynamically.
Disclaimer
All information, articles, and product details provided on this website are for general informational and educational purposes only. We do not claim any ownership over, nor do we intend to infringe upon, any trademarks, copyrights, logos, brand names, or other intellectual property mentioned or depicted on this site. Such intellectual property remains the property of its respective owners, and any references here are made solely for identification or informational purposes, without implying any affiliation, endorsement, or partnership.
We make no representations or warranties, express or implied, regarding the accuracy, completeness, or suitability of any content or products presented. Nothing on this website should be construed as legal, tax, investment, financial, medical, or other professional advice. In addition, no part of this site—including articles or product references—constitutes a solicitation, recommendation, endorsement, advertisement, or offer to buy or sell any securities, franchises, or other financial instruments, particularly in jurisdictions where such activity would be unlawful.
All content is of a general nature and may not address the specific circumstances of any individual or entity. It is not a substitute for professional advice or services. Any actions you take based on the information provided here are strictly at your own risk. You accept full responsibility for any decisions or outcomes arising from your use of this website and agree to release us from any liability in connection with your use of, or reliance upon, the content or products found herein.