
|
Kemper Corporation (KMPR) DCF -Bewertung |
Fully Editable: Tailor To Your Needs In Excel Or Sheets
Professional Design: Trusted, Industry-Standard Templates
Investor-Approved Valuation Models
MAC/PC Compatible, Fully Unlocked
No Expertise Is Needed; Easy To Follow
Kemper Corporation (KMPR) Bundle
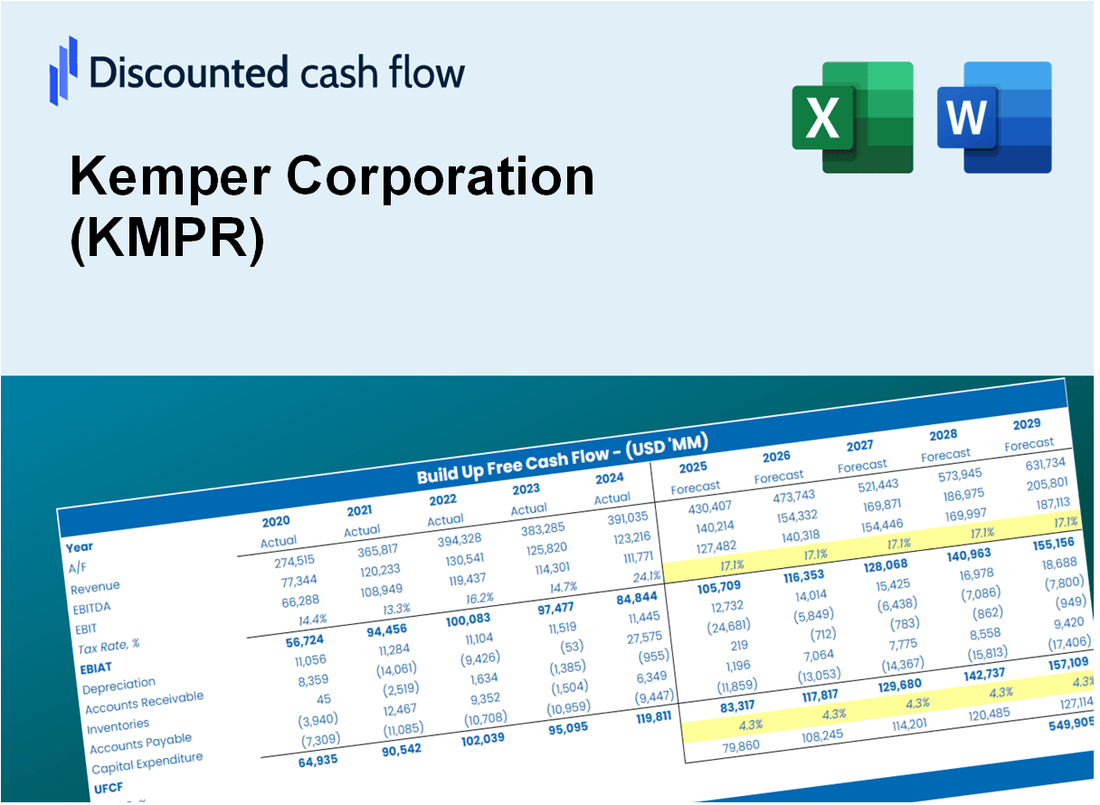
Unser DCF -Taschenrechner von KMPR (Kemper Corporation) für die Genauigkeit ermöglicht es Ihnen, die Bewertung der Kemper Corporation mithilfe der tatsächlichen Finanzdaten zu bewerten und vollständige Flexibilität zu bieten, um alle Schlüsselparameter für erweiterte Projektionen zu ändern.
What You Will Get
- Editable Forecast Inputs: Easily modify assumptions (growth %, margins, WACC) to generate various scenarios.
- Real-World Data: Kemper Corporation’s financial data pre-filled to kickstart your analysis.
- Automatic DCF Outputs: The template computes Net Present Value (NPV) and intrinsic value for you.
- Customizable and Professional: A sleek Excel model that adjusts to your valuation requirements.
- Built for Analysts and Investors: Perfect for evaluating projections, confirming strategies, and saving time.
Key Features
- Comprehensive DCF Calculator: Offers in-depth unlevered and levered DCF valuation models tailored for Kemper Corporation (KMPR).
- WACC Estimator: Features a pre-configured Weighted Average Cost of Capital sheet with adjustable inputs.
- Customizable Forecast Parameters: Easily alter growth projections, capital expenditures, and discount rates.
- Integrated Financial Ratios: Evaluate profitability, leverage, and efficiency ratios specific to Kemper Corporation (KMPR).
- Interactive Dashboard and Visuals: Graphical representations summarize essential valuation metrics for straightforward analysis.
How It Works
- Step 1: Download the prebuilt Excel template featuring Kemper Corporation’s (KMPR) data.
- Step 2: Navigate through the pre-filled sheets to familiarize yourself with the essential metrics.
- Step 3: Modify forecasts and assumptions in the editable yellow cells (WACC, growth, margins).
- Step 4: Instantly see the recalculated results, including Kemper Corporation’s (KMPR) intrinsic value.
- Step 5: Make well-informed investment choices or create reports based on the outputs.
Why Choose Kemper Corporation's Calculator?
- All-in-One Solution: Features DCF, WACC, and financial ratio analyses tailored for Kemper Corporation (KMPR).
- Flexible Inputs: Modify the highlighted fields to explore different financial scenarios.
- In-Depth Analysis: Automatically computes Kemper's intrinsic value and Net Present Value.
- Preloaded Information: Utilizes historical and projected data for precise calculations.
- Expert-Level Tool: Perfect for financial analysts, investors, and business advisors focused on Kemper Corporation (KMPR).
Who Should Use This Product?
- Professional Investors: Develop comprehensive and dependable valuation models for analyzing portfolios involving Kemper Corporation (KMPR).
- Corporate Finance Teams: Evaluate valuation scenarios to inform strategic decisions within the organization.
- Consultants and Advisors: Deliver precise valuation insights to clients considering investments in Kemper Corporation (KMPR).
- Students and Educators: Utilize real-world data to enhance learning and practice in financial modeling.
- Insurance Analysts: Gain insights into how insurance companies like Kemper Corporation (KMPR) are valued in the financial landscape.
What the Template Contains
- Comprehensive DCF Model: Editable template featuring detailed valuation calculations specific to Kemper Corporation (KMPR).
- Real-World Data: Kemper’s historical and projected financials preloaded for thorough analysis.
- Customizable Parameters: Modify WACC, growth rates, and tax assumptions to explore various scenarios.
- Financial Statements: Complete annual and quarterly breakdowns for enhanced insights.
- Key Ratios: Integrated analysis for profitability, efficiency, and leverage metrics.
- Dashboard with Visual Outputs: Charts and tables designed for clear, actionable results.
Disclaimer
All information, articles, and product details provided on this website are for general informational and educational purposes only. We do not claim any ownership over, nor do we intend to infringe upon, any trademarks, copyrights, logos, brand names, or other intellectual property mentioned or depicted on this site. Such intellectual property remains the property of its respective owners, and any references here are made solely for identification or informational purposes, without implying any affiliation, endorsement, or partnership.
We make no representations or warranties, express or implied, regarding the accuracy, completeness, or suitability of any content or products presented. Nothing on this website should be construed as legal, tax, investment, financial, medical, or other professional advice. In addition, no part of this site—including articles or product references—constitutes a solicitation, recommendation, endorsement, advertisement, or offer to buy or sell any securities, franchises, or other financial instruments, particularly in jurisdictions where such activity would be unlawful.
All content is of a general nature and may not address the specific circumstances of any individual or entity. It is not a substitute for professional advice or services. Any actions you take based on the information provided here are strictly at your own risk. You accept full responsibility for any decisions or outcomes arising from your use of this website and agree to release us from any liability in connection with your use of, or reliance upon, the content or products found herein.