
|
Kiniksa Pharmaceuticals, Ltd. (KNSA) DCF -Bewertung |
Fully Editable: Tailor To Your Needs In Excel Or Sheets
Professional Design: Trusted, Industry-Standard Templates
Investor-Approved Valuation Models
MAC/PC Compatible, Fully Unlocked
No Expertise Is Needed; Easy To Follow
Kiniksa Pharmaceuticals, Ltd. (KNSA) Bundle
Unser KNSA-DCF-Taschenrechner wurde für die Genauigkeit entwickelt und ermöglicht es Ihnen, Kiniksa Pharmaceuticals, Ltd. Bewertung unter Verwendung realer Finanzdaten zu bewerten, und bietet vollständige Flexibilität, um alle wesentlichen Parameter für erweiterte Projektionen zu ändern.
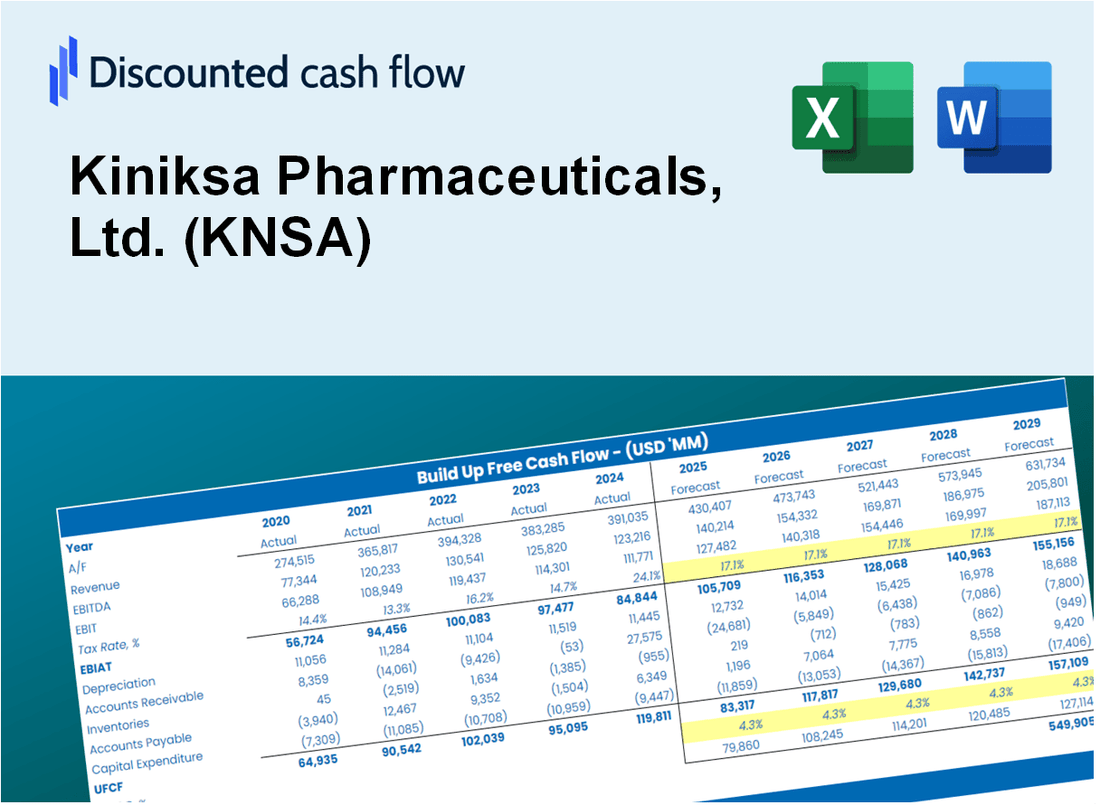
Discounted Cash Flow (DCF) - (USD MM)
| Year | AY1 2020 |
AY2 2021 |
AY3 2022 |
AY4 2023 |
AY5 2024 |
FY1 2025 |
FY2 2026 |
FY3 2027 |
FY4 2028 |
FY5 2029 |
|---|---|---|---|---|---|---|---|---|---|---|
| Revenue | .0 | 38.5 | 220.2 | 270.3 | 423.2 | 613.0 | 887.9 | 1,286.0 | 1,862.6 | 2,697.7 |
| Revenue Growth, % | 0 | 0 | 471.24 | 22.74 | 56.6 | 44.84 | 44.84 | 44.84 | 44.84 | 44.84 |
| EBITDA | -152.4 | -154.3 | 9.8 | -22.9 | -43.9 | -17.6 | -25.6 | -37.0 | -53.6 | -77.7 |
| EBITDA, % | 100 | -400.27 | 4.44 | -8.46 | -10.38 | -2.88 | -2.88 | -2.88 | -2.88 | -2.88 |
| Depreciation | 3.8 | 4.1 | 4.2 | 2.3 | 1.7 | 139.5 | 202.1 | 292.6 | 423.9 | 613.9 |
| Depreciation, % | 100 | 10.6 | 1.92 | 0.86621 | 0.40048 | 22.76 | 22.76 | 22.76 | 22.76 | 22.76 |
| EBIT | -156.2 | -158.4 | 5.6 | -25.2 | -45.6 | -21.6 | -31.2 | -45.2 | -65.5 | -94.8 |
| EBIT, % | 100 | -410.87 | 2.52 | -9.32 | -10.78 | -3.52 | -3.52 | -3.52 | -3.52 | -3.52 |
| Total Cash | 323.5 | 182.2 | 190.6 | 206.4 | 243.6 | 515.5 | 746.7 | 1,081.5 | 1,566.4 | 2,268.7 |
| Total Cash, percent | .0 | .0 | .0 | .0 | .0 | .0 | .0 | .0 | .0 | .0 |
| Account Receivables | .0 | 4.0 | 20.3 | 21.3 | 41.7 | 168.3 | 243.8 | 353.1 | 511.4 | 740.7 |
| Account Receivables, % | 100 | 10.34 | 9.23 | 7.87 | 9.86 | 27.46 | 27.46 | 27.46 | 27.46 | 27.46 |
| Inventories | .0 | 3.7 | 21.6 | 31.1 | 26.4 | 168.1 | 243.4 | 352.6 | 510.7 | 739.6 |
| Inventories, % | 100 | 9.53 | 9.81 | 11.52 | 6.23 | 27.42 | 27.42 | 27.42 | 27.42 | 27.42 |
| Accounts Payable | .5 | 1.9 | 7.9 | 8.2 | 2.0 | 137.3 | 198.8 | 288.0 | 417.1 | 604.1 |
| Accounts Payable, % | 100 | 4.85 | 3.59 | 3.05 | 0.48176 | 22.39 | 22.39 | 22.39 | 22.39 | 22.39 |
| Capital Expenditure | -.3 | -20.4 | -.1 | -.1 | -.3 | -65.1 | -94.3 | -136.6 | -197.9 | -286.6 |
| Capital Expenditure, % | 100 | -52.97 | -0.04768826 | -0.04810201 | -0.06544765 | -10.63 | -10.63 | -10.63 | -10.63 | -10.63 |
| Tax Rate, % | -19.48 | -19.48 | -19.48 | -19.48 | -19.48 | -19.48 | -19.48 | -19.48 | -19.48 | -19.48 |
| EBITAT | -161.4 | -159.8 | 92.3 | 21.3 | -54.5 | -17.2 | -25.0 | -36.2 | -52.4 | -75.9 |
| Depreciation | ||||||||||
| Changes in Account Receivables | ||||||||||
| Changes in Inventories | ||||||||||
| Changes in Accounts Payable | ||||||||||
| Capital Expenditure | ||||||||||
| UFCF | -157.4 | -182.4 | 68.2 | 13.4 | -75.0 | -75.9 | -6.5 | -9.5 | -13.7 | -19.9 |
| WACC, % | 4.68 | 4.68 | 4.68 | 4.67 | 4.68 | 4.68 | 4.68 | 4.68 | 4.68 | 4.68 |
| PV UFCF | ||||||||||
| SUM PV UFCF | -114.0 | |||||||||
| Long Term Growth Rate, % | 2.00 | |||||||||
| Free cash flow (T + 1) | -20 | |||||||||
| Terminal Value | -757 | |||||||||
| Present Terminal Value | -602 | |||||||||
| Enterprise Value | -716 | |||||||||
| Net Debt | -174 | |||||||||
| Equity Value | -543 | |||||||||
| Diluted Shares Outstanding, MM | 71 | |||||||||
| Equity Value Per Share | -7.60 |
What You Will Get
- Real KNSA Financials: Access to historical and projected data for precise valuation.
- Customizable Inputs: Adjust WACC, tax rates, revenue growth, and capital expenditures as needed.
- Dynamic Calculations: Intrinsic value and NPV are computed in real-time.
- Scenario Analysis: Explore various scenarios to assess Kiniksa Pharmaceuticals' future performance.
- User-Friendly Design: Crafted for industry professionals while remaining approachable for newcomers.
Key Features
- Comprehensive Financial Data: Gain access to precise pre-loaded historical figures and future forecasts for Kiniksa Pharmaceuticals, Ltd. (KNSA).
- Tailorable Forecast Inputs: Modify highlighted fields such as WACC, growth projections, and profit margins.
- Automated Calculations: Enjoy real-time updates to DCF, Net Present Value (NPV), and cash flow assessments.
- User-Friendly Dashboard: View intuitive charts and summaries for a clear understanding of your valuation insights.
- Designed for All Levels: An easy-to-navigate format suitable for investors, CFOs, and consultants alike.
How It Works
- Step 1: Download the Excel file.
- Step 2: Review pre-entered Kiniksa Pharmaceuticals data (historical and projected).
- Step 3: Adjust key assumptions (yellow cells) based on your analysis.
- Step 4: View automatic recalculations for Kiniksa Pharmaceuticals' intrinsic value.
- Step 5: Use the outputs for investment decisions or reporting.
Why Choose This Calculator for Kiniksa Pharmaceuticals, Ltd. (KNSA)?
- Designed for Industry Experts: A sophisticated tool utilized by analysts, CFOs, and pharmaceutical consultants.
- Accurate Financial Data: Kiniksa’s historical and projected financials are preloaded for precision.
- Flexible Scenario Analysis: Effortlessly simulate various forecasts and assumptions.
- Comprehensive Outputs: Instantly calculates intrinsic value, NPV, and essential metrics.
- User-Friendly Interface: Step-by-step guidance to facilitate your calculations.
Who Should Use This Product?
- Investors: Assess Kiniksa Pharmaceuticals' valuation prior to making investment decisions.
- CFOs and Financial Analysts: Optimize valuation methodologies and evaluate financial forecasts.
- Startup Founders: Understand valuation practices of established biotech companies like Kiniksa Pharmaceuticals.
- Consultants: Provide comprehensive valuation reports for clients in the pharmaceutical sector.
- Students and Educators: Utilize real-time data to study and teach valuation strategies.
What the Template Contains
- Pre-Filled Data: Includes Kiniksa Pharmaceuticals’ historical financials and projections.
- Discounted Cash Flow Model: Editable DCF valuation model with automated calculations.
- Weighted Average Cost of Capital (WACC): A dedicated sheet for calculating WACC based on user-defined inputs.
- Key Financial Ratios: Evaluate Kiniksa's profitability, efficiency, and financial leverage.
- Customizable Inputs: Easily modify revenue growth rates, margins, and tax assumptions.
- Clear Dashboard: Visual representations and tables summarizing essential valuation outcomes.
Disclaimer
All information, articles, and product details provided on this website are for general informational and educational purposes only. We do not claim any ownership over, nor do we intend to infringe upon, any trademarks, copyrights, logos, brand names, or other intellectual property mentioned or depicted on this site. Such intellectual property remains the property of its respective owners, and any references here are made solely for identification or informational purposes, without implying any affiliation, endorsement, or partnership.
We make no representations or warranties, express or implied, regarding the accuracy, completeness, or suitability of any content or products presented. Nothing on this website should be construed as legal, tax, investment, financial, medical, or other professional advice. In addition, no part of this site—including articles or product references—constitutes a solicitation, recommendation, endorsement, advertisement, or offer to buy or sell any securities, franchises, or other financial instruments, particularly in jurisdictions where such activity would be unlawful.
All content is of a general nature and may not address the specific circumstances of any individual or entity. It is not a substitute for professional advice or services. Any actions you take based on the information provided here are strictly at your own risk. You accept full responsibility for any decisions or outcomes arising from your use of this website and agree to release us from any liability in connection with your use of, or reliance upon, the content or products found herein.