|
Kinetik Holdings Inc. (KNTK) DCF -Bewertung |
Fully Editable: Tailor To Your Needs In Excel Or Sheets
Professional Design: Trusted, Industry-Standard Templates
Investor-Approved Valuation Models
MAC/PC Compatible, Fully Unlocked
No Expertise Is Needed; Easy To Follow
Kinetik Holdings Inc. (KNTK) Bundle
Verbessern Sie Ihre Anlagestrategien mit dem DCF -Taschenrechner von Kinetik Holdings Inc. (KNTK)! Tauchen Sie in authentische Kinetik -Finanzdaten ein, passen Sie Wachstumsprojektionen und -kosten an und beobachten Sie sofort, wie sich diese Veränderungen auf den inneren Wert von Kinetik Holdings Inc. (KNTK) auswirken.
What You Will Get
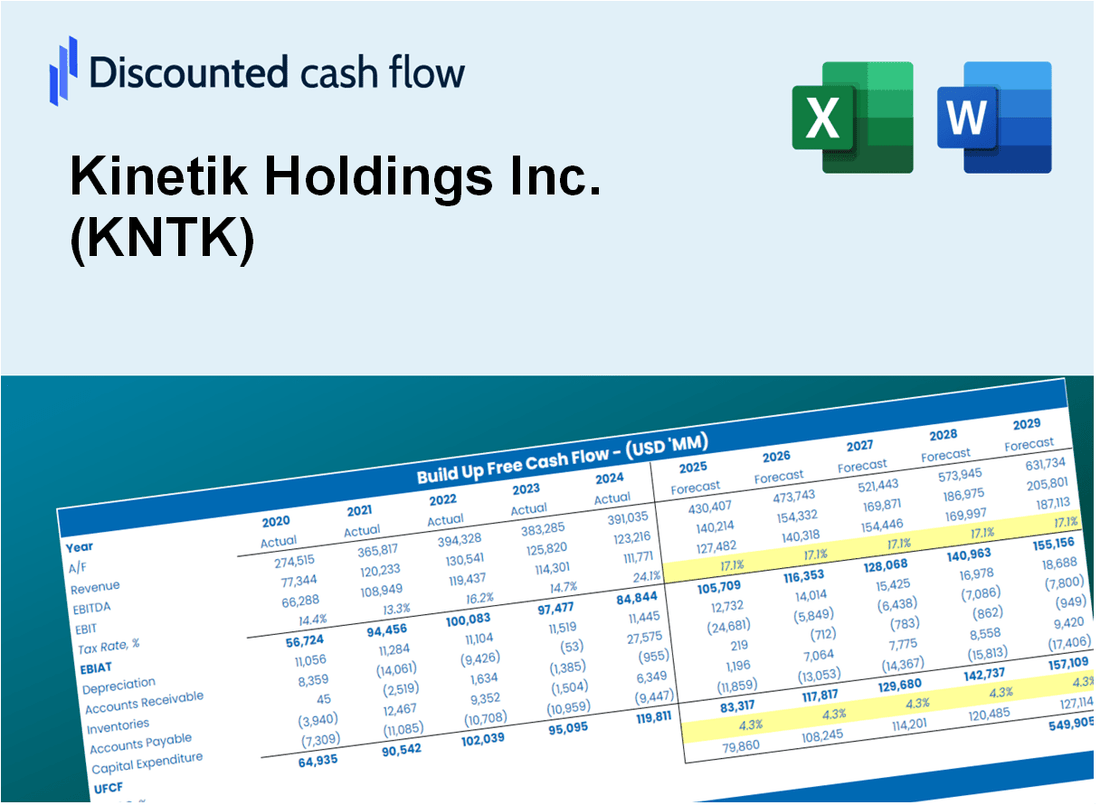
- Editable Excel Template: A fully customizable Excel-based DCF Calculator featuring pre-filled real KNTK financials.
- Real-World Data: Historical data and forward-looking estimates (as indicated in the yellow cells).
- Forecast Flexibility: Adjust forecast assumptions such as revenue growth, EBITDA %, and WACC.
- Automatic Calculations: Instantly observe the effects of your inputs on Kinetik Holdings' valuation.
- Professional Tool: Designed for investors, CFOs, consultants, and financial analysts.
- User-Friendly Design: Organized for clarity and ease of use, complete with step-by-step instructions.
Key Features
- 🔍 Real-Life KNTK Financials: Pre-filled historical and projected data for Kinetik Holdings Inc. (KNTK).
- ✏️ Fully Customizable Inputs: Adjust all critical parameters (yellow cells) like WACC, growth %, and tax rates.
- 📊 Professional DCF Valuation: Built-in formulas calculate Kinetik’s intrinsic value using the Discounted Cash Flow method.
- ⚡ Instant Results: Visualize Kinetik’s valuation instantly after making changes.
- Scenario Analysis: Test and compare outcomes for various financial assumptions side-by-side.
How It Works
- 1. Access the Model: Download and open the Excel file containing Kinetik Holdings Inc.'s preloaded data.
- 2. Adjust Key Inputs: Modify essential parameters such as growth rates, WACC, and capital expenditures.
- 3. Analyze Results Immediately: The DCF model automatically calculates intrinsic value and NPV in real-time.
- 4. Explore Different Scenarios: Evaluate various forecasts to understand different valuation possibilities.
- 5. Present with Assurance: Deliver professional valuation analyses to bolster your decision-making.
Why Choose Kinetik Holdings Inc. (KNTK)?
- Innovative Solutions: Leverage cutting-edge technology to enhance your investment strategies.
- Data-Driven Insights: Access reliable analytics that support informed decision-making.
- Customizable Options: Adapt our services to meet your unique business needs and goals.
- User-Friendly Interface: Navigate our platform with ease for a seamless experience.
- Expertise You Can Trust: Collaborate with industry professionals dedicated to your success.
Who Should Use This Product?
- Investors: Assess Kinetik Holdings Inc. (KNTK) valuation prior to making investment decisions.
- CFOs and Financial Analysts: Enhance valuation methodologies and evaluate financial forecasts.
- Startup Founders: Gain insights into how established companies like Kinetik Holdings Inc. (KNTK) are appraised.
- Consultants: Provide comprehensive valuation reports for their clientele.
- Students and Educators: Utilize current data to learn and teach valuation strategies.
What the Template Contains
- Pre-Filled DCF Model: Kinetik Holdings Inc.'s (KNTK) financial data preloaded for immediate use.
- WACC Calculator: Detailed calculations for Weighted Average Cost of Capital tailored for Kinetik Holdings Inc. (KNTK).
- Financial Ratios: Evaluate Kinetik Holdings Inc.'s (KNTK) profitability, leverage, and efficiency.
- Editable Inputs: Change assumptions such as growth, margins, and CAPEX to fit your scenarios for Kinetik Holdings Inc. (KNTK).
- Financial Statements: Annual and quarterly reports for Kinetik Holdings Inc. (KNTK) to support detailed analysis.
- Interactive Dashboard: Easily visualize key valuation metrics and results for Kinetik Holdings Inc. (KNTK).
Disclaimer
All information, articles, and product details provided on this website are for general informational and educational purposes only. We do not claim any ownership over, nor do we intend to infringe upon, any trademarks, copyrights, logos, brand names, or other intellectual property mentioned or depicted on this site. Such intellectual property remains the property of its respective owners, and any references here are made solely for identification or informational purposes, without implying any affiliation, endorsement, or partnership.
We make no representations or warranties, express or implied, regarding the accuracy, completeness, or suitability of any content or products presented. Nothing on this website should be construed as legal, tax, investment, financial, medical, or other professional advice. In addition, no part of this site—including articles or product references—constitutes a solicitation, recommendation, endorsement, advertisement, or offer to buy or sell any securities, franchises, or other financial instruments, particularly in jurisdictions where such activity would be unlawful.
All content is of a general nature and may not address the specific circumstances of any individual or entity. It is not a substitute for professional advice or services. Any actions you take based on the information provided here are strictly at your own risk. You accept full responsibility for any decisions or outcomes arising from your use of this website and agree to release us from any liability in connection with your use of, or reliance upon, the content or products found herein.