
|
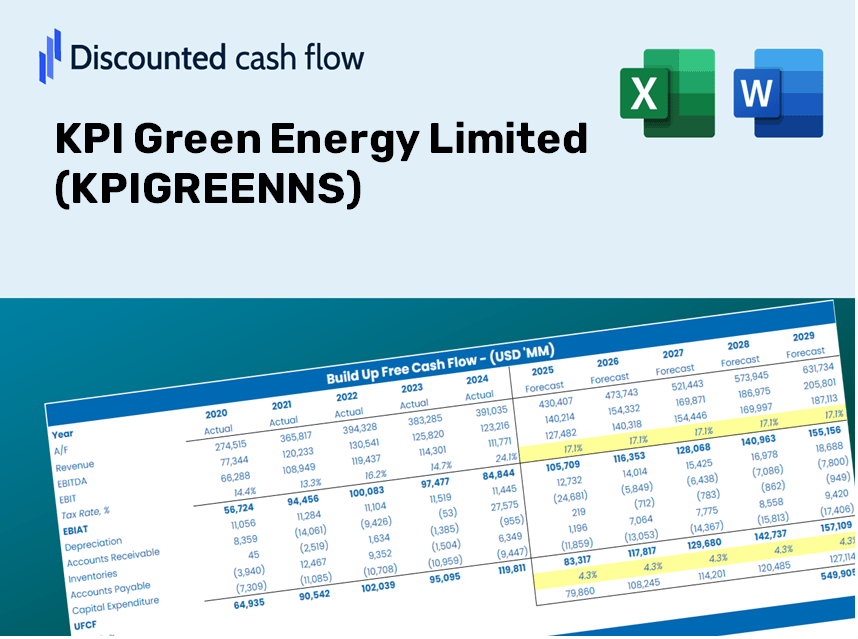
KPI Green Energy Limited (Kpigreen.NS) DCF -Bewertung |
Fully Editable: Tailor To Your Needs In Excel Or Sheets
Professional Design: Trusted, Industry-Standard Templates
Investor-Approved Valuation Models
MAC/PC Compatible, Fully Unlocked
No Expertise Is Needed; Easy To Follow
KPI Green Energy Limited (KPIGREEN.NS) Bundle
Bewerten Sie die finanziellen Aussichten von KPI Green Energy Limited wie ein Experte! Dieser (KPigReenns) DCF-Taschenrechner verfügt über vorgefüllte Finanzdaten und bietet eine vollständige Flexibilität, um das Umsatzwachstum, WACC, Margen und andere kritische Annahmen zu ändern, um sich mit Ihren Vorhersagen anzupassen.
Discounted Cash Flow (DCF) - (USD MM)
| Year | AY1 2021 |
AY2 2022 |
AY3 2023 |
AY4 2024 |
AY5 2025 |
FY1 2026 |
FY2 2027 |
FY3 2028 |
FY4 2029 |
FY5 2030 |
|---|---|---|---|---|---|---|---|---|---|---|
| Revenue | 1,035.0 | 2,299.4 | 6,437.9 | 10,239.0 | 17,354.5 | 31,608.6 | 57,570.1 | 104,855.1 | 190,977.2 | 347,835.3 |
| Revenue Growth, % | 0 | 122.16 | 179.98 | 59.04 | 69.49 | 82.13 | 82.13 | 82.13 | 82.13 | 82.13 |
| EBITDA | 629.3 | 1,103.5 | 2,080.9 | 3,380.7 | 5,637.7 | 13,061.5 | 23,789.6 | 43,329.0 | 78,917.0 | 143,735.1 |
| EBITDA, % | 60.8 | 47.99 | 32.32 | 33.02 | 32.49 | 41.32 | 41.32 | 41.32 | 41.32 | 41.32 |
| Depreciation | 164.7 | 140.6 | 226.2 | 403.7 | 605.1 | 2,084.4 | 3,796.4 | 6,914.5 | 12,593.7 | 22,937.5 |
| Depreciation, % | 15.91 | 6.11 | 3.51 | 3.94 | 3.49 | 6.59 | 6.59 | 6.59 | 6.59 | 6.59 |
| EBIT | 464.6 | 962.9 | 1,854.7 | 2,977.0 | 5,032.6 | 10,977.2 | 19,993.2 | 36,414.5 | 66,323.3 | 120,797.6 |
| EBIT, % | 44.88 | 41.87 | 28.81 | 29.07 | 29 | 34.73 | 34.73 | 34.73 | 34.73 | 34.73 |
| Total Cash | 216.8 | 269.3 | 535.2 | 1,701.2 | 5,974.7 | 5,817.1 | 10,594.9 | 19,296.9 | 35,146.3 | 64,013.6 |
| Total Cash, percent | .0 | .0 | .0 | .0 | .0 | .0 | .0 | .0 | .0 | .0 |
| Account Receivables | 498.7 | 367.8 | 1,467.3 | 4,271.3 | 5,781.2 | 10,241.3 | 18,652.9 | 33,973.4 | 61,877.2 | 112,699.7 |
| Account Receivables, % | 48.18 | 16 | 22.79 | 41.72 | 33.31 | 32.4 | 32.4 | 32.4 | 32.4 | 32.4 |
| Inventories | 402.7 | 1,066.6 | 1,649.8 | 3,338.6 | 4,661.6 | 10,771.2 | 19,618.1 | 35,731.4 | 65,079.1 | 118,531.5 |
| Inventories, % | 38.91 | 46.39 | 25.63 | 32.61 | 26.86 | 34.08 | 34.08 | 34.08 | 34.08 | 34.08 |
| Accounts Payable | 218.1 | 468.4 | 2,273.8 | 4,166.1 | 4,201.0 | 8,955.3 | 16,310.8 | 29,707.5 | 54,107.6 | 98,548.7 |
| Accounts Payable, % | 21.07 | 20.37 | 35.32 | 40.69 | 24.21 | 28.33 | 28.33 | 28.33 | 28.33 | 28.33 |
| Capital Expenditure | -635.3 | -1,906.4 | -2,662.8 | -1,866.4 | -13,349.2 | -17,751.3 | -32,331.3 | -58,886.4 | -107,252.5 | -195,343.7 |
| Capital Expenditure, % | -61.38 | -82.91 | -41.36 | -18.23 | -76.92 | -56.16 | -56.16 | -56.16 | -56.16 | -56.16 |
| Tax Rate, % | 27.52 | 27.52 | 27.52 | 27.52 | 27.52 | 27.52 | 27.52 | 27.52 | 27.52 | 27.52 |
| EBITAT | 296.3 | 701.5 | 1,433.2 | 2,217.6 | 3,647.7 | 7,922.8 | 14,430.1 | 26,282.2 | 47,868.9 | 87,185.7 |
| Depreciation | ||||||||||
| Changes in Account Receivables | ||||||||||
| Changes in Inventories | ||||||||||
| Changes in Accounts Payable | ||||||||||
| Capital Expenditure | ||||||||||
| UFCF | -857.6 | -1,347.0 | -880.6 | -1,845.7 | -11,894.4 | -13,559.5 | -24,007.9 | -43,726.7 | -79,641.3 | -145,054.3 |
| WACC, % | 4.72 | 4.78 | 4.82 | 4.79 | 4.78 | 4.78 | 4.78 | 4.78 | 4.78 | 4.78 |
| PV UFCF | ||||||||||
| SUM PV UFCF | -253,762.3 | |||||||||
| Long Term Growth Rate, % | 2.00 | |||||||||
| Free cash flow (T + 1) | -147,955 | |||||||||
| Terminal Value | -5,325,639 | |||||||||
| Present Terminal Value | -4,217,136 | |||||||||
| Enterprise Value | -4,470,898 | |||||||||
| Net Debt | 8,774 | |||||||||
| Equity Value | -4,479,672 | |||||||||
| Diluted Shares Outstanding, MM | 199 | |||||||||
| Equity Value Per Share | -22,554.21 |
What You'll Receive
- Customizable Excel Template: A fully adaptable Excel-based DCF Calculator featuring pre-filled financial data for KPIGREENNS.
- Real Data Insights: Access to historical figures and projected estimates (highlighted in the yellow cells).
- Flexible Forecasting: Modify assumptions regarding revenue growth, EBITDA %, and WACC as needed.
- Instant Calculations: Quickly observe how your inputs affect the valuation of KPI Green Energy Limited (KPIGREENNS).
- Professional Tool: Designed for investors, CFOs, consultants, and financial analysts alike.
- Intuitive Design: Organized for simplicity and ease of use, complete with step-by-step guidance.
Key Features
- Customizable Energy Forecast Parameters: Adjust essential metrics such as energy production growth, EBITDA %, and investment in renewable projects.
- Instant DCF Valuation: Quickly determines intrinsic value, NPV, and other crucial outputs.
- Top-Tier Accuracy: Leverages KPI Green Energy's (KPIGREENNS) actual financial data for precise valuation results.
- Effortless Scenario Analysis: Evaluate various assumptions and compare results with ease.
- Efficiency Booster: Streamline your workflow by avoiding the creation of intricate valuation models from the ground up.
How It Works
- Download: Obtain the pre-configured Excel file containing KPI Green Energy Limited’s (KPIGREENNS) financial metrics.
- Customize: Tailor forecasts, such as anticipated growth, EBITDA margins, and WACC adjustments.
- Update Automatically: The intrinsic value and NPV calculations refresh in real-time.
- Test Scenarios: Generate various projections and evaluate the results immediately.
- Make Decisions: Leverage the valuation outputs to inform your investment choices.
Why Opt for This Calculator?
- User-Friendly and Accessible: Perfect for both novices and seasoned professionals.
- Customizable Inputs: Adjust variables effortlessly to suit your analysis needs.
- Real-Time Feedback: Witness immediate updates to KPI Green Energy's valuation as you tweak inputs.
- Pre-Loaded Data: Comes equipped with KPI Green Energy's actual financial information for swift evaluations.
- Professionally Endorsed: Utilized by investors and analysts for informed decision-making.
Who Can Benefit from KPI Green Energy Limited (KPIGREENNS)?
- Investors: Accurately assess the fair value of KPI Green Energy Limited (KPIGREENNS) prior to making investment choices.
- CFOs: Utilize a high-quality DCF model for robust financial reporting and analysis.
- Consultants: Efficiently customize the template for valuation reports tailored to clients.
- Entrepreneurs: Acquire insights into financial modeling practices employed by leading energy companies.
- Educators: Employ it as an instructional resource to illustrate valuation techniques.
What the Template Includes
- Preloaded KPIGREENNS Data: Historical and projected financial data, encompassing revenue, EBIT, and capital expenditures.
- DCF and WACC Models: Professional-grade sheets designed for calculating intrinsic value and Weighted Average Cost of Capital.
- Editable Inputs: Yellow-highlighted cells for modifying revenue growth, tax rates, and discount rates.
- Financial Statements: Detailed annual and quarterly financials for in-depth analysis.
- Key Ratios: Metrics for profitability, leverage, and efficiency to assess performance.
- Dashboard and Charts: Visual representations of valuation results and underlying assumptions.
Disclaimer
All information, articles, and product details provided on this website are for general informational and educational purposes only. We do not claim any ownership over, nor do we intend to infringe upon, any trademarks, copyrights, logos, brand names, or other intellectual property mentioned or depicted on this site. Such intellectual property remains the property of its respective owners, and any references here are made solely for identification or informational purposes, without implying any affiliation, endorsement, or partnership.
We make no representations or warranties, express or implied, regarding the accuracy, completeness, or suitability of any content or products presented. Nothing on this website should be construed as legal, tax, investment, financial, medical, or other professional advice. In addition, no part of this site—including articles or product references—constitutes a solicitation, recommendation, endorsement, advertisement, or offer to buy or sell any securities, franchises, or other financial instruments, particularly in jurisdictions where such activity would be unlawful.
All content is of a general nature and may not address the specific circumstances of any individual or entity. It is not a substitute for professional advice or services. Any actions you take based on the information provided here are strictly at your own risk. You accept full responsibility for any decisions or outcomes arising from your use of this website and agree to release us from any liability in connection with your use of, or reliance upon, the content or products found herein.