
|
Kalpataru Projects International Limited (KPIL.NS) DCF -Bewertung |
Fully Editable: Tailor To Your Needs In Excel Or Sheets
Professional Design: Trusted, Industry-Standard Templates
Investor-Approved Valuation Models
MAC/PC Compatible, Fully Unlocked
No Expertise Is Needed; Easy To Follow
Kalpataru Projects International Limited (KPIL.NS) Bundle
Entdecken Sie das wahre Potenzial von Kalpataru Projects International Limited (KPILNS) mit unserem fortschrittlichen DCF -Taschenrechner! Passen Sie die wichtigsten Annahmen an, erkunden Sie verschiedene Szenarien und untersuchen, wie Änderungen die Bewertung von Kalpataru Projects International Limited (KPILNS) beeinflussen - alles innerhalb einer umfassenden Excel -Vorlage.
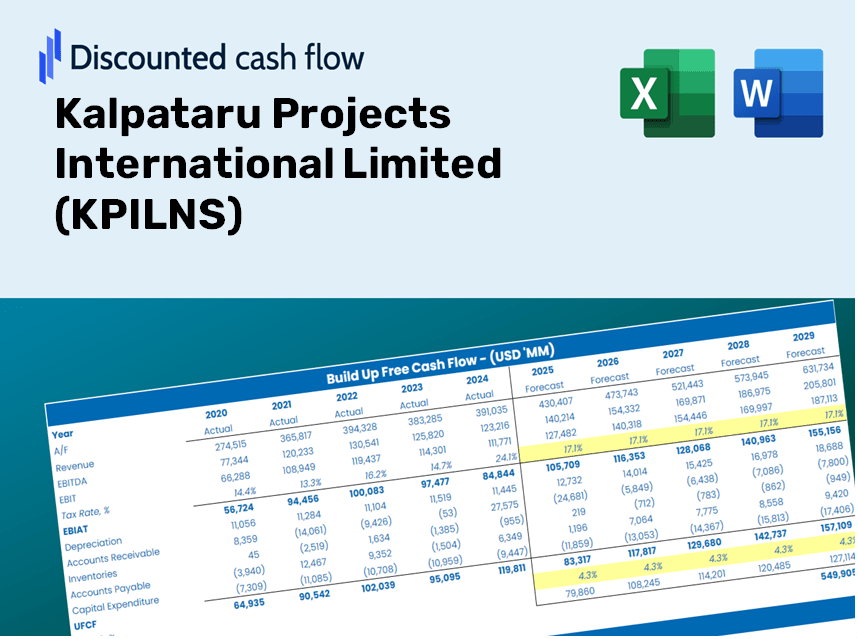
Discounted Cash Flow (DCF) - (USD MM)
| Year | AY1 2021 |
AY2 2022 |
AY3 2023 |
AY4 2024 |
AY5 2025 |
FY1 2026 |
FY2 2027 |
FY3 2028 |
FY4 2029 |
FY5 2030 |
|---|---|---|---|---|---|---|---|---|---|---|
| Revenue | 129,494.4 | 147,773.8 | 163,614.4 | 196,264.3 | 223,157.8 | 255,791.0 | 293,196.4 | 336,071.6 | 385,216.7 | 441,548.4 |
| Revenue Growth, % | 0 | 14.12 | 10.72 | 19.96 | 13.7 | 14.62 | 14.62 | 14.62 | 14.62 | 14.62 |
| EBITDA | 13,969.6 | 11,203.0 | 12,970.2 | 16,547.3 | 17,293.1 | 21,730.3 | 24,908.0 | 28,550.4 | 32,725.5 | 37,511.0 |
| EBITDA, % | 10.79 | 7.58 | 7.93 | 8.43 | 7.75 | 8.5 | 8.5 | 8.5 | 8.5 | 8.5 |
| Depreciation | 2,696.7 | 2,484.1 | 3,113.5 | 4,020.8 | 4,063.1 | 4,878.4 | 5,591.7 | 6,409.5 | 7,346.7 | 8,421.1 |
| Depreciation, % | 2.08 | 1.68 | 1.9 | 2.05 | 1.82 | 1.91 | 1.91 | 1.91 | 1.91 | 1.91 |
| EBIT | 11,272.9 | 8,718.9 | 9,856.7 | 12,526.5 | 13,230.0 | 16,851.9 | 19,316.3 | 22,141.0 | 25,378.7 | 29,089.9 |
| EBIT, % | 8.71 | 5.9 | 6.02 | 6.38 | 5.93 | 6.59 | 6.59 | 6.59 | 6.59 | 6.59 |
| Total Cash | 6,626.1 | 11,698.6 | 14,850.0 | 10,182.6 | 19,093.8 | 18,342.3 | 21,024.6 | 24,099.1 | 27,623.2 | 31,662.6 |
| Total Cash, percent | .0 | .0 | .0 | .0 | .0 | .0 | .0 | .0 | .0 | .0 |
| Account Receivables | 88,465.2 | 92,899.9 | 106,849.6 | 126,429.7 | 78,168.7 | 151,394.7 | 173,533.8 | 198,910.3 | 227,997.7 | 261,338.7 |
| Account Receivables, % | 68.32 | 62.87 | 65.31 | 64.42 | 35.03 | 59.19 | 59.19 | 59.19 | 59.19 | 59.19 |
| Inventories | 10,710.8 | 10,960.3 | 12,280.0 | 13,533.6 | 14,287.6 | 18,668.5 | 21,398.5 | 24,527.7 | 28,114.4 | 32,225.7 |
| Inventories, % | 8.27 | 7.42 | 7.51 | 6.9 | 6.4 | 7.3 | 7.3 | 7.3 | 7.3 | 7.3 |
| Accounts Payable | 37,391.4 | 42,533.3 | 49,038.4 | 58,554.7 | 65,879.3 | 75,195.2 | 86,191.3 | 98,795.4 | 113,242.6 | 129,802.5 |
| Accounts Payable, % | 28.87 | 28.78 | 29.97 | 29.83 | 29.52 | 29.4 | 29.4 | 29.4 | 29.4 | 29.4 |
| Capital Expenditure | -2,611.5 | -3,081.0 | -7,710.0 | -3,515.8 | -5,746.2 | -6,742.8 | -7,728.8 | -8,859.0 | -10,154.5 | -11,639.4 |
| Capital Expenditure, % | -2.02 | -2.08 | -4.71 | -1.79 | -2.57 | -2.64 | -2.64 | -2.64 | -2.64 | -2.64 |
| Tax Rate, % | 28.82 | 28.82 | 28.82 | 28.82 | 28.82 | 28.82 | 28.82 | 28.82 | 28.82 | 28.82 |
| EBITAT | 8,002.5 | 6,764.4 | 6,771.9 | 9,104.0 | 9,417.6 | 12,171.7 | 13,951.7 | 15,991.9 | 18,330.4 | 21,011.0 |
| Depreciation | ||||||||||
| Changes in Account Receivables | ||||||||||
| Changes in Inventories | ||||||||||
| Changes in Accounts Payable | ||||||||||
| Capital Expenditure | ||||||||||
| UFCF | -53,696.9 | 6,625.2 | -6,588.9 | -1,708.4 | 62,566.1 | -57,983.7 | -2,058.3 | -2,359.3 | -2,704.3 | -3,099.8 |
| WACC, % | 6.43 | 6.62 | 6.36 | 6.48 | 6.43 | 6.46 | 6.46 | 6.46 | 6.46 | 6.46 |
| PV UFCF | ||||||||||
| SUM PV UFCF | -62,605.1 | |||||||||
| Long Term Growth Rate, % | 2.00 | |||||||||
| Free cash flow (T + 1) | -3,162 | |||||||||
| Terminal Value | -70,820 | |||||||||
| Present Terminal Value | -51,777 | |||||||||
| Enterprise Value | -114,382 | |||||||||
| Net Debt | 25,542 | |||||||||
| Equity Value | -139,924 | |||||||||
| Diluted Shares Outstanding, MM | 165 | |||||||||
| Equity Value Per Share | -848.81 |
What You Will Receive
- Authentic KPILNS Financial Data: Pre-filled with Kalpataru Projects International Limited's historical and projected figures for accurate analysis.
- Completely Customizable Template: Easily adjust key inputs such as revenue growth, WACC, and EBITDA percentage.
- Instant Calculations: Witness real-time updates of Kalpataru's intrinsic value as you modify inputs.
- Professional Valuation Tool: Tailored for investors, analysts, and consultants seeking reliable DCF outcomes.
- Intuitive Design: Streamlined layout and straightforward instructions accessible for all skill levels.
Key Features
- Comprehensive DCF Calculator: Features detailed unlevered and levered DCF valuation models tailored for Kalpataru Projects International Limited (KPILNS).
- WACC Estimator: Pre-designed Weighted Average Cost of Capital sheet with adjustable inputs to suit your analysis needs.
- Customizable Forecast Parameters: Easily alter growth projections, capital investment, and discount rates.
- Integrated Financial Ratios: Evaluate profitability, leverage, and efficiency ratios specific to Kalpataru Projects International Limited (KPILNS).
- Visual Dashboard and Charts: Graphical outputs provide a clear summary of essential valuation metrics for streamlined analysis.
How It Works
- Step 1: Download the ready-to-use Excel template featuring data for Kalpataru Projects International Limited (KPILNS).
- Step 2: Navigate through the pre-filled sheets to familiarize yourself with essential metrics.
- Step 3: Modify forecasts and assumptions within the editable yellow cells (WACC, growth, margins).
- Step 4: Instantly observe the recalculated outcomes, including the intrinsic value of Kalpataru Projects International Limited (KPILNS).
- Step 5: Utilize the generated outputs to make well-informed investment decisions or create comprehensive reports.
Why Choose This Calculator for Kalpataru Projects International Limited (KPILNS)?
- Designed for Industry Experts: A sophisticated tool crafted for analysts, financial officers, and consultants.
- Accurate Financial Data: Preloaded historical and projected financials for Kalpataru Projects to ensure precision.
- Flexible Scenario Analysis: Effortlessly explore various forecasts and assumptions.
- Comprehensive Outputs: Instantly calculates intrinsic value, NPV, and other essential metrics.
- User-Friendly: Clear, step-by-step instructions make it easy to navigate through the tool.
Who Should Use This Product?
- Finance Students: Master valuation techniques and apply them with real-world data.
- Academics: Utilize industry-standard models in your teaching or research endeavors.
- Investors: Validate your hypotheses and evaluate valuation results for Kalpataru Projects International Limited (KPILNS).
- Analysts: Enhance your efficiency with a ready-to-use, customizable DCF model.
- Small Business Owners: Discover how major public companies like Kalpataru Projects International Limited (KPILNS) are assessed.
Contents of the Template
- Pre-Filled DCF Model: Financial data for Kalpataru Projects International Limited (KPILNS) already included for quick access.
- WACC Calculator: Comprehensive calculations for the Weighted Average Cost of Capital.
- Financial Ratios: Assess Kalpataru's profitability, leverage, and operational efficiency.
- Editable Inputs: Modify assumptions such as growth rates, profit margins, and CAPEX to tailor your analyses.
- Financial Statements: Annual and quarterly reports available for in-depth evaluation.
- Interactive Dashboard: Effortlessly visualize essential valuation metrics and outcomes.
Disclaimer
All information, articles, and product details provided on this website are for general informational and educational purposes only. We do not claim any ownership over, nor do we intend to infringe upon, any trademarks, copyrights, logos, brand names, or other intellectual property mentioned or depicted on this site. Such intellectual property remains the property of its respective owners, and any references here are made solely for identification or informational purposes, without implying any affiliation, endorsement, or partnership.
We make no representations or warranties, express or implied, regarding the accuracy, completeness, or suitability of any content or products presented. Nothing on this website should be construed as legal, tax, investment, financial, medical, or other professional advice. In addition, no part of this site—including articles or product references—constitutes a solicitation, recommendation, endorsement, advertisement, or offer to buy or sell any securities, franchises, or other financial instruments, particularly in jurisdictions where such activity would be unlawful.
All content is of a general nature and may not address the specific circumstances of any individual or entity. It is not a substitute for professional advice or services. Any actions you take based on the information provided here are strictly at your own risk. You accept full responsibility for any decisions or outcomes arising from your use of this website and agree to release us from any liability in connection with your use of, or reliance upon, the content or products found herein.