
|
Koninklijke KPN N.V. (KPN.as) DCF -Bewertung |
Fully Editable: Tailor To Your Needs In Excel Or Sheets
Professional Design: Trusted, Industry-Standard Templates
Investor-Approved Valuation Models
MAC/PC Compatible, Fully Unlocked
No Expertise Is Needed; Easy To Follow
Koninklijke KPN N.V. (KPN.AS) Bundle
Unser (KPNAS) DCF-Taschenrechner entwickelt für die Genauigkeit und ermöglicht es Ihnen, Koninklijke KPN N.V.-Bewertung mithilfe realer Finanzdaten zu bewerten und vollständige Flexibilität zu bieten, um alle wichtigen Parameter für verbesserte Projektionen zu ändern.
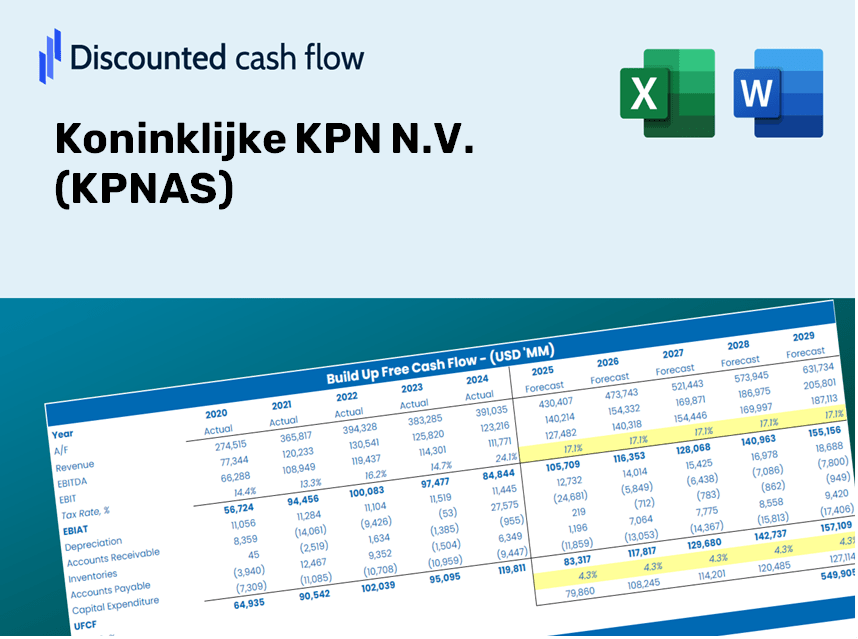
Discounted Cash Flow (DCF) - (USD MM)
| Year | AY1 2020 |
AY2 2021 |
AY3 2022 |
AY4 2023 |
AY5 2024 |
FY1 2025 |
FY2 2026 |
FY3 2027 |
FY4 2028 |
FY5 2029 |
|---|---|---|---|---|---|---|---|---|---|---|
| Revenue | 5,284.0 | 5,271.0 | 5,312.0 | 5,439.0 | 5,603.0 | 5,686.2 | 5,770.6 | 5,856.2 | 5,943.2 | 6,031.4 |
| Revenue Growth, % | 0 | -0.24603 | 0.77784 | 2.39 | 3.02 | 1.48 | 1.48 | 1.48 | 1.48 | 1.48 |
| EBITDA | 2,403.0 | 3,293.0 | 2,186.0 | 2,560.0 | 2,603.0 | 2,759.2 | 2,800.2 | 2,841.8 | 2,884.0 | 2,926.8 |
| EBITDA, % | 45.48 | 62.47 | 41.15 | 47.07 | 46.46 | 48.53 | 48.53 | 48.53 | 48.53 | 48.53 |
| Depreciation | 1,524.0 | 1,444.0 | 1,299.0 | 1,206.0 | 1,240.0 | 1,421.5 | 1,442.6 | 1,464.0 | 1,485.7 | 1,507.8 |
| Depreciation, % | 28.84 | 27.4 | 24.45 | 22.17 | 22.13 | 25 | 25 | 25 | 25 | 25 |
| EBIT | 879.0 | 1,849.0 | 887.0 | 1,354.0 | 1,363.0 | 1,337.8 | 1,357.6 | 1,377.8 | 1,398.2 | 1,419.0 |
| EBIT, % | 16.64 | 35.08 | 16.7 | 24.89 | 24.33 | 23.53 | 23.53 | 23.53 | 23.53 | 23.53 |
| Total Cash | 867.0 | 1,107.0 | 527.0 | 828.0 | 802.0 | 874.2 | 887.1 | 900.3 | 913.7 | 927.2 |
| Total Cash, percent | .0 | .0 | .0 | .0 | .0 | .0 | .0 | .0 | .0 | .0 |
| Account Receivables | 686.0 | 629.0 | 700.0 | 536.0 | 578.0 | 662.6 | 672.4 | 682.4 | 692.5 | 702.8 |
| Account Receivables, % | 12.98 | 11.93 | 13.18 | 9.85 | 10.32 | 11.65 | 11.65 | 11.65 | 11.65 | 11.65 |
| Inventories | 47.0 | 37.0 | 49.0 | 43.0 | 45.0 | 46.7 | 47.4 | 48.1 | 48.8 | 49.5 |
| Inventories, % | 0.88948 | 0.70195 | 0.92244 | 0.79059 | 0.80314 | 0.82152 | 0.82152 | 0.82152 | 0.82152 | 0.82152 |
| Accounts Payable | 531.0 | 514.0 | 591.0 | 537.0 | 600.0 | 585.8 | 594.5 | 603.3 | 612.2 | 621.3 |
| Accounts Payable, % | 10.05 | 9.75 | 11.13 | 9.87 | 10.71 | 10.3 | 10.3 | 10.3 | 10.3 | 10.3 |
| Capital Expenditure | -1,564.0 | -1,220.0 | -1,206.0 | -1,249.0 | -1,314.0 | -1,385.9 | -1,406.4 | -1,427.3 | -1,448.5 | -1,470.0 |
| Capital Expenditure, % | -29.6 | -23.15 | -22.7 | -22.96 | -23.45 | -24.37 | -24.37 | -24.37 | -24.37 | -24.37 |
| Tax Rate, % | 21.84 | 21.84 | 21.84 | 21.84 | 21.84 | 21.84 | 21.84 | 21.84 | 21.84 | 21.84 |
| EBITAT | 758.5 | 1,463.7 | 679.6 | 1,050.3 | 1,065.3 | 1,064.3 | 1,080.1 | 1,096.1 | 1,112.4 | 1,128.9 |
| Depreciation | ||||||||||
| Changes in Account Receivables | ||||||||||
| Changes in Inventories | ||||||||||
| Changes in Accounts Payable | ||||||||||
| Capital Expenditure | ||||||||||
| UFCF | 516.5 | 1,737.7 | 766.6 | 1,123.3 | 1,010.3 | 999.4 | 1,114.4 | 1,131.0 | 1,147.7 | 1,164.8 |
| WACC, % | 4.42 | 4.33 | 4.3 | 4.32 | 4.32 | 4.34 | 4.34 | 4.34 | 4.34 | 4.34 |
| PV UFCF | ||||||||||
| SUM PV UFCF | 4,887.3 | |||||||||
| Long Term Growth Rate, % | 2.00 | |||||||||
| Free cash flow (T + 1) | 1,188 | |||||||||
| Terminal Value | 50,777 | |||||||||
| Present Terminal Value | 41,060 | |||||||||
| Enterprise Value | 45,947 | |||||||||
| Net Debt | 6,435 | |||||||||
| Equity Value | 39,512 | |||||||||
| Diluted Shares Outstanding, MM | 3,900 | |||||||||
| Equity Value Per Share | 10.13 |
What You Will Receive
- Adjustable Forecast Inputs: Seamlessly modify assumptions (growth %, margins, WACC) to generate various scenarios.
- Comprehensive Financial Data: KPN's financial information pre-loaded to expedite your analysis.
- Instant DCF Outputs: The template automatically computes Net Present Value (NPV) and intrinsic value for you.
- Tailorable and Professional: A refined Excel model that caters to your valuation requirements.
- Designed for Analysts and Investors: Perfect for evaluating projections, validating strategies, and enhancing efficiency.
Key Features
- Pre-Loaded Data: Historical financial statements and pre-filled forecasts for Koninklijke KPN N.V. (KPNAS).
- Fully Adjustable Inputs: Customize WACC, tax rates, revenue growth, and EBITDA margins.
- Instant Results: View the intrinsic value of Koninklijke KPN N.V. (KPNAS) update in real time.
- Clear Visual Outputs: Dashboard charts showcase valuation results and essential metrics.
- Built for Accuracy: A professional-grade tool designed for analysts, investors, and finance professionals.
How It Functions
- Step 1: Download the Excel file for Koninklijke KPN N.V. (KPNAS).
- Step 2: Examine the pre-filled financial data and projections for KPN.
- Step 3: Adjust key inputs such as revenue growth, WACC, and tax rates (highlighted cells).
- Step 4: Observe the DCF model refresh in real-time as you modify the assumptions.
- Step 5: Evaluate the results and leverage the findings for your investment strategies.
Why Opt for This Calculator?
- Designed for Professionals: A sophisticated tool utilized by analysts, CFOs, and consultants.
- Accurate Data: Historical and projected financials for Koninklijke KPN N.V. (KPNAS) preloaded for reliability.
- Scenario Analysis: Easily simulate various forecasts and assumptions.
- Comprehensive Outputs: Automatically computes intrinsic value, NPV, and essential metrics.
- User-Friendly: Step-by-step guidance to streamline your experience.
Who Can Benefit from This Product?
- Finance Students: Discover valuation methods and practice them with actual data.
- Researchers: Integrate industry-standard models into your academic studies or research projects.
- Investors: Validate your assumptions and evaluate the valuation results for Koninklijke KPN N.V. (KPNAS).
- Financial Analysts: Enhance your efficiency with a ready-to-use, customizable DCF model.
- Small Business Owners: Understand how major public companies like Koninklijke KPN N.V. (KPNAS) are evaluated.
Contents of the Template
- Pre-Filled DCF Model: KPN's financial data preloaded for immediate analysis.
- WACC Calculator: Comprehensive calculations for the Weighted Average Cost of Capital.
- Financial Ratios: Assess KPN's profitability, leverage, and operational efficiency.
- Editable Inputs: Adjust variables such as growth rates, margins, and CAPEX to suit your analysis.
- Financial Statements: Annual and quarterly reports available for in-depth examination.
- Interactive Dashboard: Effortlessly visualize essential valuation metrics and outcomes.
Disclaimer
All information, articles, and product details provided on this website are for general informational and educational purposes only. We do not claim any ownership over, nor do we intend to infringe upon, any trademarks, copyrights, logos, brand names, or other intellectual property mentioned or depicted on this site. Such intellectual property remains the property of its respective owners, and any references here are made solely for identification or informational purposes, without implying any affiliation, endorsement, or partnership.
We make no representations or warranties, express or implied, regarding the accuracy, completeness, or suitability of any content or products presented. Nothing on this website should be construed as legal, tax, investment, financial, medical, or other professional advice. In addition, no part of this site—including articles or product references—constitutes a solicitation, recommendation, endorsement, advertisement, or offer to buy or sell any securities, franchises, or other financial instruments, particularly in jurisdictions where such activity would be unlawful.
All content is of a general nature and may not address the specific circumstances of any individual or entity. It is not a substitute for professional advice or services. Any actions you take based on the information provided here are strictly at your own risk. You accept full responsibility for any decisions or outcomes arising from your use of this website and agree to release us from any liability in connection with your use of, or reliance upon, the content or products found herein.