
|
Kingspan Group Plc (KRX.IR) DCF -Bewertung |
Fully Editable: Tailor To Your Needs In Excel Or Sheets
Professional Design: Trusted, Industry-Standard Templates
Investor-Approved Valuation Models
MAC/PC Compatible, Fully Unlocked
No Expertise Is Needed; Easy To Follow
Kingspan Group plc (KRX.IR) Bundle
Als Anleger oder Analyst ist dieser [Symbol] DCF-Taschenrechner Ihre Anlaufstelle für eine genaue Bewertung. Mit echten Daten von Kingspan Group PLC geladen, können Sie Ihre Prognosen anpassen und die Auswirkungen sofort beobachten.
What You Will Receive
- Adjustable Forecast Inputs: Effortlessly modify key assumptions (growth %, margins, WACC) for various scenarios.
- Real-World Data: Kingspan Group plc’s financial information pre-loaded to enhance your analysis.
- Automated DCF Outputs: The model computes Net Present Value (NPV) and intrinsic value automatically.
- Tailored and Professional: A refined Excel template designed to meet your valuation requirements.
- Designed for Analysts and Investors: Perfect for evaluating projections, confirming strategies, and optimizing your time.
Key Features
- Authentic Kingspan Financial Data: Gain access to precise historical data and future forecasts tailored for KRXIR.
- Flexible Forecast Inputs: Customize key assumptions by editing the highlighted cells for WACC, growth rates, and profit margins.
- Real-Time Calculations: Automatic adjustments to DCF, Net Present Value (NPV), and cash flow assessments.
- User-Friendly Dashboard: Clear and concise charts and summaries designed to help you interpret your valuation outcomes.
- Suitable for All Levels: An intuitive framework crafted for investors, CFOs, and consultants alike.
How It Functions
- Download: Obtain the pre-prepared Excel file containing Kingspan Group plc's (KRXIR) financial data.
- Customize: Modify forecasts, including revenue growth, EBITDA %, and WACC as needed.
- Update Automatically: Watch as intrinsic value and NPV calculations refresh in real time.
- Test Scenarios: Generate various projections and instantly compare results.
- Make Decisions: Leverage the valuation outcomes to inform your investment strategy.
Why Choose the Kingspan Group plc (KRXIR) Calculator?
- Time Efficient: Get started instantly with a pre-built DCF model – no need to start from square one.
- Enhanced Accuracy: Access to reliable financial data and formulas minimizes valuation errors.
- Completely Customizable: Adjust the model to fit your specific assumptions and forecasts.
- User-Friendly: Intuitive charts and outputs simplify result analysis.
- Preferred by Professionals: Crafted for experts who prioritize precision and ease of use.
Who Can Benefit from Kingspan Group plc (KRXIR)?
- Investors: Make informed investment choices with our advanced valuation tool.
- Financial Analysts: Streamline your workflow with a customizable DCF model at your fingertips.
- Consultants: Effortlessly modify the template for impactful client presentations or reports.
- Finance Enthusiasts: Enhance your grasp of valuation methodologies through practical, real-world case studies.
- Educators and Students: Leverage this resource as a hands-on learning aid in finance-related disciplines.
Contents of the Template
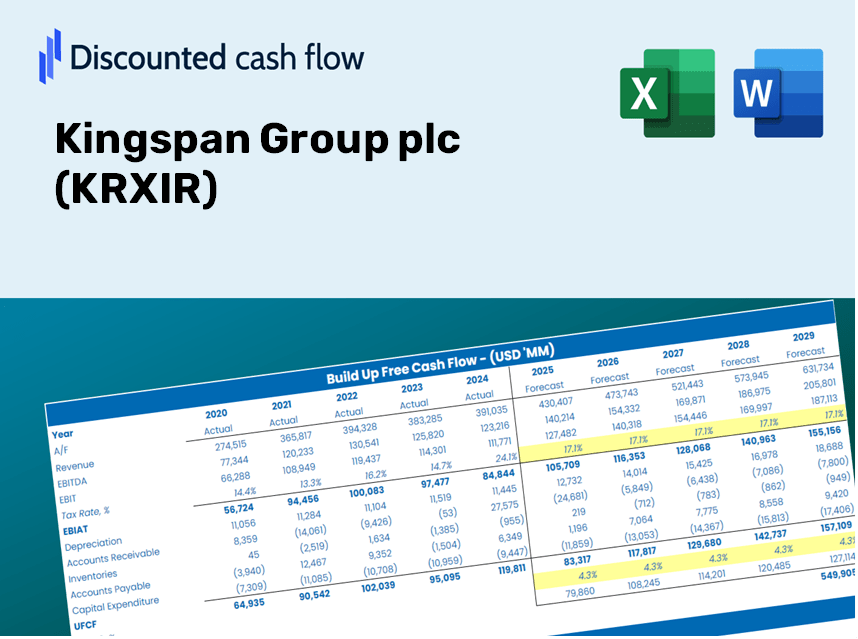
- Operating and Balance Sheet Data: Pre-filled historical data and forecasts for Kingspan Group plc (KRXIR), including revenue, EBITDA, EBIT, and capital expenditures.
- WACC Calculation: A dedicated sheet for Weighted Average Cost of Capital (WACC), featuring key parameters such as Beta, risk-free rate, and share price.
- DCF Valuation (Unlevered and Levered): Customizable Discounted Cash Flow models that reveal intrinsic value with comprehensive calculations.
- Financial Statements: Pre-loaded annual and quarterly financial statements to aid in analysis.
- Key Ratios: Includes ratios related to profitability, leverage, and efficiency for Kingspan Group plc (KRXIR).
- Dashboard and Charts: A visual overview of valuation outputs and assumptions for straightforward analysis of results.
Disclaimer
All information, articles, and product details provided on this website are for general informational and educational purposes only. We do not claim any ownership over, nor do we intend to infringe upon, any trademarks, copyrights, logos, brand names, or other intellectual property mentioned or depicted on this site. Such intellectual property remains the property of its respective owners, and any references here are made solely for identification or informational purposes, without implying any affiliation, endorsement, or partnership.
We make no representations or warranties, express or implied, regarding the accuracy, completeness, or suitability of any content or products presented. Nothing on this website should be construed as legal, tax, investment, financial, medical, or other professional advice. In addition, no part of this site—including articles or product references—constitutes a solicitation, recommendation, endorsement, advertisement, or offer to buy or sell any securities, franchises, or other financial instruments, particularly in jurisdictions where such activity would be unlawful.
All content is of a general nature and may not address the specific circumstances of any individual or entity. It is not a substitute for professional advice or services. Any actions you take based on the information provided here are strictly at your own risk. You accept full responsibility for any decisions or outcomes arising from your use of this website and agree to release us from any liability in connection with your use of, or reliance upon, the content or products found herein.