
|
KT Corporation (KT) DCF -Bewertung |
Fully Editable: Tailor To Your Needs In Excel Or Sheets
Professional Design: Trusted, Industry-Standard Templates
Investor-Approved Valuation Models
MAC/PC Compatible, Fully Unlocked
No Expertise Is Needed; Easy To Follow
KT Corporation (KT) Bundle
Entdecken Sie die finanzielle Zukunft der KT Corporation (KT) mit unserem benutzerfreundlichen DCF-Taschenrechner! Geben Sie Ihre Annahmen in Bezug auf Wachstum, Margen und Kosten ein, um den inneren Wert der KT Corporation (KT) zu berechnen und Ihre Anlagestrategie zu verbessern.
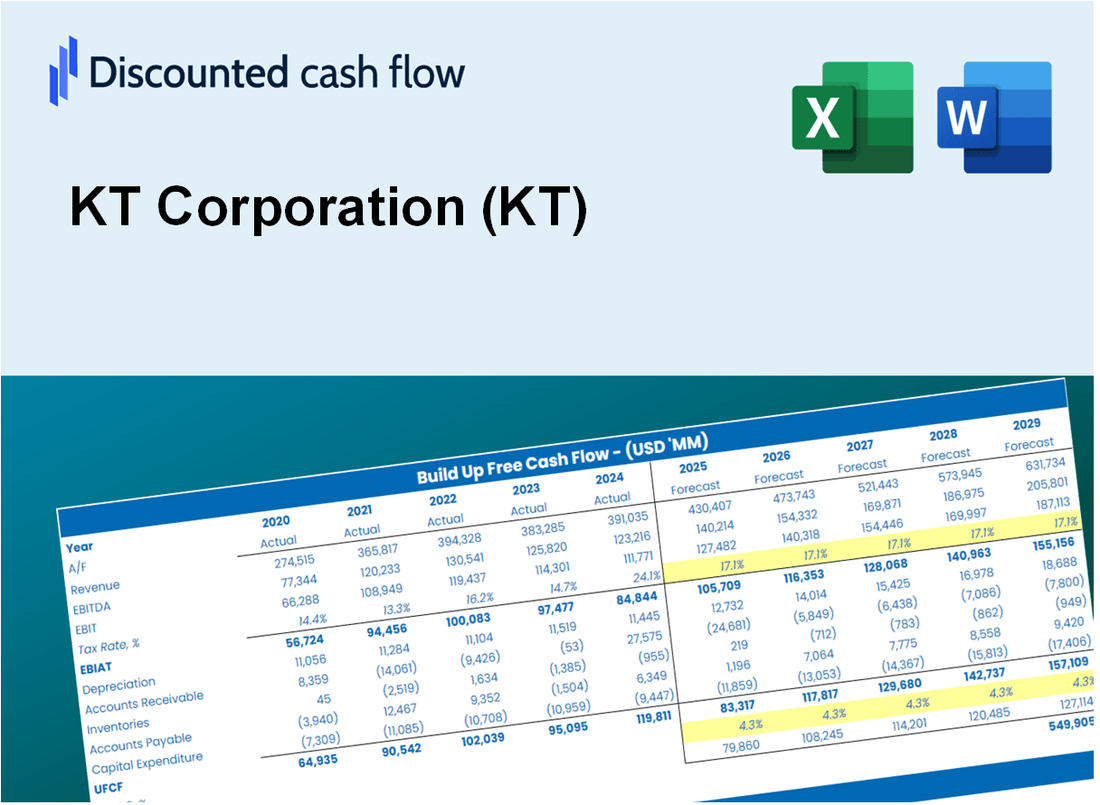
Discounted Cash Flow (DCF) - (USD MM)
| Year | AY1 2020 |
AY2 2021 |
AY3 2022 |
AY4 2023 |
AY5 2024 |
FY1 2025 |
FY2 2026 |
FY3 2027 |
FY4 2028 |
FY5 2029 |
|---|---|---|---|---|---|---|---|---|---|---|
| Revenue | 16,571.1 | 17,120.3 | 17,637.4 | 18,075.5 | 18,174.5 | 18,600.1 | 19,035.6 | 19,481.3 | 19,937.5 | 20,404.3 |
| Revenue Growth, % | 0 | 3.31 | 3.02 | 2.48 | 0.54781 | 2.34 | 2.34 | 2.34 | 2.34 | 2.34 |
| EBITDA | 3,009.3 | 3,282.7 | 4,028.3 | 3,800.3 | 2,913.7 | 3,617.0 | 3,701.7 | 3,788.4 | 3,877.1 | 3,967.8 |
| EBITDA, % | 18.16 | 19.17 | 22.84 | 21.02 | 16.03 | 19.45 | 19.45 | 19.45 | 19.45 | 19.45 |
| Depreciation | 2,244.0 | 2,233.8 | 2,513.8 | 2,659.6 | 2,357.0 | 2,549.1 | 2,608.8 | 2,669.9 | 2,732.4 | 2,796.4 |
| Depreciation, % | 13.54 | 13.05 | 14.25 | 14.71 | 12.97 | 13.7 | 13.7 | 13.7 | 13.7 | 13.7 |
| EBIT | 765.3 | 1,048.9 | 1,514.5 | 1,140.7 | 556.6 | 1,067.8 | 1,092.8 | 1,118.4 | 1,144.6 | 1,171.4 |
| EBIT, % | 4.62 | 6.13 | 8.59 | 6.31 | 3.06 | 5.74 | 5.74 | 5.74 | 5.74 | 5.74 |
| Total Cash | 2,638.7 | 2,891.6 | 2,593.4 | 2,970.3 | 3,480.0 | 3,091.2 | 3,163.6 | 3,237.7 | 3,313.5 | 3,391.1 |
| Total Cash, percent | .0 | .0 | .0 | .0 | .0 | .0 | .0 | .0 | .0 | .0 |
| Account Receivables | 3,372.4 | 3,502.3 | 4,194.2 | 4,932.7 | 4,227.9 | 4,283.3 | 4,383.6 | 4,486.2 | 4,591.2 | 4,698.7 |
| Account Receivables, % | 20.35 | 20.46 | 23.78 | 27.29 | 23.26 | 23.03 | 23.03 | 23.03 | 23.03 | 23.03 |
| Inventories | 367.6 | 353.5 | 493.5 | 679.6 | 725.2 | 551.7 | 564.7 | 577.9 | 591.4 | 605.3 |
| Inventories, % | 2.22 | 2.07 | 2.8 | 3.76 | 3.99 | 2.97 | 2.97 | 2.97 | 2.97 | 2.97 |
| Accounts Payable | 852.4 | 1,057.0 | 791.1 | 892.4 | 712.9 | 917.4 | 938.9 | 960.9 | 983.4 | 1,006.4 |
| Accounts Payable, % | 5.14 | 6.17 | 4.49 | 4.94 | 3.92 | 4.93 | 4.93 | 4.93 | 4.93 | 4.93 |
| Capital Expenditure | -2,561.0 | -2,923.4 | -2,741.6 | -2,869.2 | -2,000.6 | -2,788.4 | -2,853.7 | -2,920.5 | -2,988.9 | -3,058.9 |
| Capital Expenditure, % | -15.45 | -17.08 | -15.54 | -15.87 | -11.01 | -14.99 | -14.99 | -14.99 | -14.99 | -14.99 |
| Tax Rate, % | 19.57 | 19.57 | 19.57 | 19.57 | 19.57 | 19.57 | 19.57 | 19.57 | 19.57 | 19.57 |
| EBITAT | 520.0 | 719.4 | 1,009.3 | 855.8 | 447.7 | 765.9 | 783.8 | 802.2 | 821.0 | 840.2 |
| Depreciation | ||||||||||
| Changes in Account Receivables | ||||||||||
| Changes in Inventories | ||||||||||
| Changes in Accounts Payable | ||||||||||
| Capital Expenditure | ||||||||||
| UFCF | -2,684.7 | 118.5 | -316.1 | -177.3 | 1,283.8 | 849.4 | 447.3 | 457.7 | 468.5 | 479.4 |
| WACC, % | 4.02 | 4.03 | 4.01 | 4.1 | 4.17 | 4.07 | 4.07 | 4.07 | 4.07 | 4.07 |
| PV UFCF | ||||||||||
| SUM PV UFCF | 2,427.6 | |||||||||
| Long Term Growth Rate, % | 2.00 | |||||||||
| Free cash flow (T + 1) | 489 | |||||||||
| Terminal Value | 23,674 | |||||||||
| Present Terminal Value | 19,397 | |||||||||
| Enterprise Value | 21,825 | |||||||||
| Net Debt | 5,407 | |||||||||
| Equity Value | 16,418 | |||||||||
| Diluted Shares Outstanding, MM | 984 | |||||||||
| Equity Value Per Share | 16.68 |
What You Will Get
- Real KT Financials: Includes historical and forecasted data for accurate valuation.
- Adjustable Inputs: Modify WACC, tax rates, revenue growth, and capital expenditures.
- Automatic Calculations: Intrinsic value and NPV are calculated dynamically.
- Scenario Analysis: Test multiple scenarios to evaluate KT Corporation’s future performance.
- Clear and Intuitive Design: Built for professionals yet accessible for beginners.
Key Features
- Comprehensive DCF Calculator: Features detailed unlevered and levered DCF valuation models tailored for KT Corporation (KT).
- WACC Calculator: Pre-configured Weighted Average Cost of Capital sheet with adjustable parameters for precise calculations.
- Customizable Forecast Assumptions: Adjust growth rates, capital expenditures, and discount rates to fit your analysis needs.
- Integrated Financial Ratios: Evaluate profitability, leverage, and efficiency ratios specific to KT Corporation (KT).
- Interactive Dashboard and Charts: Visual representations that summarize essential valuation metrics for straightforward interpretation.
How It Works
- Step 1: Download the prebuilt Excel template featuring KT Corporation's (KT) data.
- Step 2: Navigate through the pre-filled sheets to familiarize yourself with the essential metrics.
- Step 3: Adjust forecasts and assumptions in the editable yellow cells (WACC, growth, margins).
- Step 4: Instantly view the updated results, including KT Corporation's intrinsic value.
- Step 5: Utilize the outputs to make informed investment decisions or create detailed reports.
Why Choose KT Corporation (KT)?
- Innovative Solutions: Leverage cutting-edge technology and services tailored for modern needs.
- Reliable Performance: Proven track record in delivering consistent and high-quality results.
- Customer-Centric Approach: Focused on understanding and meeting the unique needs of our clients.
- Expertise You Can Trust: Backed by a team of professionals with extensive industry experience.
- Commitment to Sustainability: Dedicated to environmentally friendly practices and solutions.
Who Should Use KT Corporation (KT) Products?
- Finance Students: Acquire practical skills in valuation methods and utilize real-world data.
- Academics: Integrate industry-standard models into your teaching or research initiatives.
- Investors: Validate your investment hypotheses and evaluate valuation results for KT Corporation (KT) stock.
- Analysts: Enhance your productivity with a customizable DCF model designed for efficiency.
- Small Business Owners: Understand the analytical approaches used for evaluating major public firms like KT Corporation (KT).
What the Template Contains
- Comprehensive DCF Model: Editable template with detailed valuation calculations for KT Corporation (KT).
- Real-World Data: KT's historical and projected financials preloaded for analysis.
- Customizable Parameters: Adjust WACC, growth rates, and tax assumptions to test various scenarios.
- Financial Statements: Full annual and quarterly breakdowns for deeper insights into KT's performance.
- Key Ratios: Built-in analysis for profitability, efficiency, and leverage specific to KT Corporation (KT).
- Dashboard with Visual Outputs: Charts and tables for clear, actionable results tailored to KT's financial landscape.
Disclaimer
All information, articles, and product details provided on this website are for general informational and educational purposes only. We do not claim any ownership over, nor do we intend to infringe upon, any trademarks, copyrights, logos, brand names, or other intellectual property mentioned or depicted on this site. Such intellectual property remains the property of its respective owners, and any references here are made solely for identification or informational purposes, without implying any affiliation, endorsement, or partnership.
We make no representations or warranties, express or implied, regarding the accuracy, completeness, or suitability of any content or products presented. Nothing on this website should be construed as legal, tax, investment, financial, medical, or other professional advice. In addition, no part of this site—including articles or product references—constitutes a solicitation, recommendation, endorsement, advertisement, or offer to buy or sell any securities, franchises, or other financial instruments, particularly in jurisdictions where such activity would be unlawful.
All content is of a general nature and may not address the specific circumstances of any individual or entity. It is not a substitute for professional advice or services. Any actions you take based on the information provided here are strictly at your own risk. You accept full responsibility for any decisions or outcomes arising from your use of this website and agree to release us from any liability in connection with your use of, or reliance upon, the content or products found herein.