
|
Kura Oncology, Inc. (Kura) DCF -Bewertung |
Fully Editable: Tailor To Your Needs In Excel Or Sheets
Professional Design: Trusted, Industry-Standard Templates
Investor-Approved Valuation Models
MAC/PC Compatible, Fully Unlocked
No Expertise Is Needed; Easy To Follow
Kura Oncology, Inc. (KURA) Bundle
Gewinnen Sie Einblicke in die Bewertungsanalyse Ihrer Kura Oncology, Inc. (Kura) unter Verwendung unseres ausgeklügelten DCF -Taschenrechners! Diese Excel -Vorlage mit tatsächlichen (Kura-) Daten ermöglicht es Ihnen, Prognosen und Annahmen anzupassen, um die intrinsische Wert von Kura Onkologie mit Genauigkeit zu bestimmen.
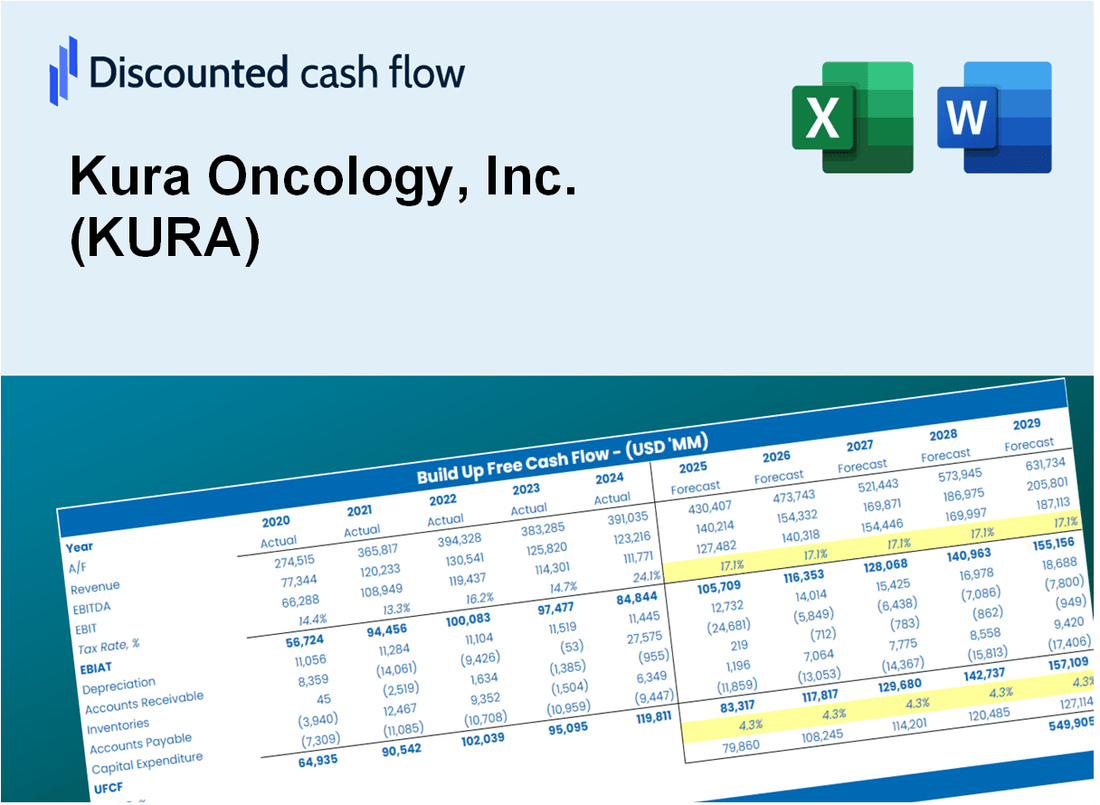
Discounted Cash Flow (DCF) - (USD MM)
| Year | AY1 2020 |
AY2 2021 |
AY3 2022 |
AY4 2023 |
AY5 2024 |
FY1 2025 |
FY2 2026 |
FY3 2027 |
FY4 2028 |
FY5 2029 |
|---|---|---|---|---|---|---|---|---|---|---|
| Revenue | .0 | .0 | .0 | .0 | 53.9 | 53.9 | 53.9 | 53.9 | 53.9 | 53.9 |
| Revenue Growth, % | 0 | 0 | 0 | 0 | 0 | 0 | 0 | 0 | 0 | 0 |
| EBITDA | -88.9 | -129.5 | -134.9 | -150.2 | -169.5 | 32.3 | 32.3 | 32.3 | 32.3 | 32.3 |
| EBITDA, % | 100 | 100 | 100 | 100 | -314.57 | 60 | 60 | 60 | 60 | 60 |
| Depreciation | .2 | .6 | .8 | .8 | .8 | 43.3 | 43.3 | 43.3 | 43.3 | 43.3 |
| Depreciation, % | 100 | 100 | 100 | 100 | 1.57 | 80.31 | 80.31 | 80.31 | 80.31 | 80.31 |
| EBIT | -89.0 | -130.1 | -135.6 | -151.1 | -170.3 | 32.3 | 32.3 | 32.3 | 32.3 | 32.3 |
| EBIT, % | 100 | 100 | 100 | 100 | -316.14 | 60 | 60 | 60 | 60 | 60 |
| Total Cash | 633.3 | 518.0 | 438.0 | 424.0 | 727.4 | 53.9 | 53.9 | 53.9 | 53.9 | 53.9 |
| Total Cash, percent | .0 | .0 | .0 | .0 | .0 | .0 | .0 | .0 | .0 | .0 |
| Account Receivables | .0 | .0 | .0 | .0 | .0 | 43.1 | 43.1 | 43.1 | 43.1 | 43.1 |
| Account Receivables, % | 100 | 100 | 100 | 100 | 0 | 80 | 80 | 80 | 80 | 80 |
| Inventories | .0 | .0 | .0 | .0 | .0 | 43.1 | 43.1 | 43.1 | 43.1 | 43.1 |
| Inventories, % | 100 | 100 | 100 | 100 | 0 | 80 | 80 | 80 | 80 | 80 |
| Accounts Payable | 2.8 | 3.2 | 1.5 | 2.3 | 1.5 | 43.4 | 43.4 | 43.4 | 43.4 | 43.4 |
| Accounts Payable, % | 100 | 100 | 100 | 100 | 2.73 | 80.55 | 80.55 | 80.55 | 80.55 | 80.55 |
| Capital Expenditure | -2.2 | -1.1 | -.6 | -.2 | -.5 | -.1 | -.1 | -.1 | -.1 | -.1 |
| Capital Expenditure, % | 100 | 100 | 100 | 100 | -0.87597 | -0.17519 | -0.17519 | -0.17519 | -0.17519 | -0.17519 |
| Tax Rate, % | -1.17 | -1.17 | -1.17 | -1.17 | -1.17 | -1.17 | -1.17 | -1.17 | -1.17 | -1.17 |
| EBITAT | -89.0 | -130.1 | -135.6 | -151.1 | -172.3 | 32.3 | 32.3 | 32.3 | 32.3 | 32.3 |
| Depreciation | ||||||||||
| Changes in Account Receivables | ||||||||||
| Changes in Inventories | ||||||||||
| Changes in Accounts Payable | ||||||||||
| Capital Expenditure | ||||||||||
| UFCF | -88.3 | -130.2 | -137.2 | -149.6 | -172.8 | 31.2 | 75.5 | 75.5 | 75.5 | 75.5 |
| WACC, % | 4.9 | 4.9 | 4.9 | 4.9 | 4.9 | 4.9 | 4.9 | 4.9 | 4.9 | 4.9 |
| PV UFCF | ||||||||||
| SUM PV UFCF | 285.6 | |||||||||
| Long Term Growth Rate, % | 2.00 | |||||||||
| Free cash flow (T + 1) | 77 | |||||||||
| Terminal Value | 2,652 | |||||||||
| Present Terminal Value | 2,087 | |||||||||
| Enterprise Value | 2,373 | |||||||||
| Net Debt | -208 | |||||||||
| Equity Value | 2,581 | |||||||||
| Diluted Shares Outstanding, MM | 86 | |||||||||
| Equity Value Per Share | 29.95 |
What You Will Receive
- Pre-Filled Financial Model: Kura Oncology’s actual data facilitates accurate DCF valuation.
- Full Forecast Control: Modify revenue growth, margins, WACC, and other essential parameters.
- Instant Calculations: Real-time updates guarantee you see results as adjustments are made.
- Investor-Ready Template: A polished Excel file crafted for professional-level valuation.
- Customizable and Reusable: Designed for adaptability, enabling repeated use for in-depth forecasts.
Key Features
- Real-Life KURA Data: Pre-filled with Kura Oncology’s historical financials and forward-looking projections.
- Fully Customizable Inputs: Adjust revenue growth, margins, WACC, tax rates, and capital expenditures.
- Dynamic Valuation Model: Automatic updates to Net Present Value (NPV) and intrinsic value based on your inputs.
- Scenario Testing: Create multiple forecast scenarios to analyze different valuation outcomes.
- User-Friendly Design: Simple, structured, and designed for professionals and beginners alike.
How It Works
- Step 1: Download the prebuilt Excel template with Kura Oncology’s data included.
- Step 2: Explore the pre-filled sheets and understand the key metrics.
- Step 3: Update forecasts and assumptions in the editable yellow cells (WACC, growth, margins).
- Step 4: Instantly view recalculated results, including Kura Oncology’s intrinsic value.
- Step 5: Make informed investment decisions or generate reports using the outputs.
Why Choose Kura Oncology, Inc. (KURA)?
- Innovative Solutions: Cutting-edge therapies designed to target cancer with precision.
- Proven Expertise: A team of seasoned professionals dedicated to advancing oncology treatments.
- Robust Pipeline: A diverse portfolio of drug candidates in various stages of development.
- Commitment to Patients: Focused on improving outcomes and quality of life for cancer patients.
- Strong Partnerships: Collaborations with leading research institutions and healthcare organizations.
Who Should Use This Product?
- Individual Investors: Make informed decisions about buying or selling Kura Oncology stock (KURA).
- Financial Analysts: Streamline valuation processes with ready-to-use financial models specific to Kura Oncology (KURA).
- Consultants: Deliver professional valuation insights on Kura Oncology (KURA) to clients quickly and accurately.
- Business Owners: Understand how biotech companies like Kura Oncology (KURA) are valued to guide your own strategy.
- Finance Students: Learn valuation techniques using real-world data and scenarios related to Kura Oncology (KURA).
What the Template Contains
- Pre-Filled DCF Model: Kura Oncology's financial data preloaded for immediate use.
- WACC Calculator: Detailed calculations for Weighted Average Cost of Capital.
- Financial Ratios: Evaluate Kura Oncology's profitability, leverage, and efficiency.
- Editable Inputs: Change assumptions such as growth, margins, and CAPEX to fit your scenarios.
- Financial Statements: Annual and quarterly reports to support detailed analysis.
- Interactive Dashboard: Easily visualize key valuation metrics and results.
Disclaimer
All information, articles, and product details provided on this website are for general informational and educational purposes only. We do not claim any ownership over, nor do we intend to infringe upon, any trademarks, copyrights, logos, brand names, or other intellectual property mentioned or depicted on this site. Such intellectual property remains the property of its respective owners, and any references here are made solely for identification or informational purposes, without implying any affiliation, endorsement, or partnership.
We make no representations or warranties, express or implied, regarding the accuracy, completeness, or suitability of any content or products presented. Nothing on this website should be construed as legal, tax, investment, financial, medical, or other professional advice. In addition, no part of this site—including articles or product references—constitutes a solicitation, recommendation, endorsement, advertisement, or offer to buy or sell any securities, franchises, or other financial instruments, particularly in jurisdictions where such activity would be unlawful.
All content is of a general nature and may not address the specific circumstances of any individual or entity. It is not a substitute for professional advice or services. Any actions you take based on the information provided here are strictly at your own risk. You accept full responsibility for any decisions or outcomes arising from your use of this website and agree to release us from any liability in connection with your use of, or reliance upon, the content or products found herein.