
|
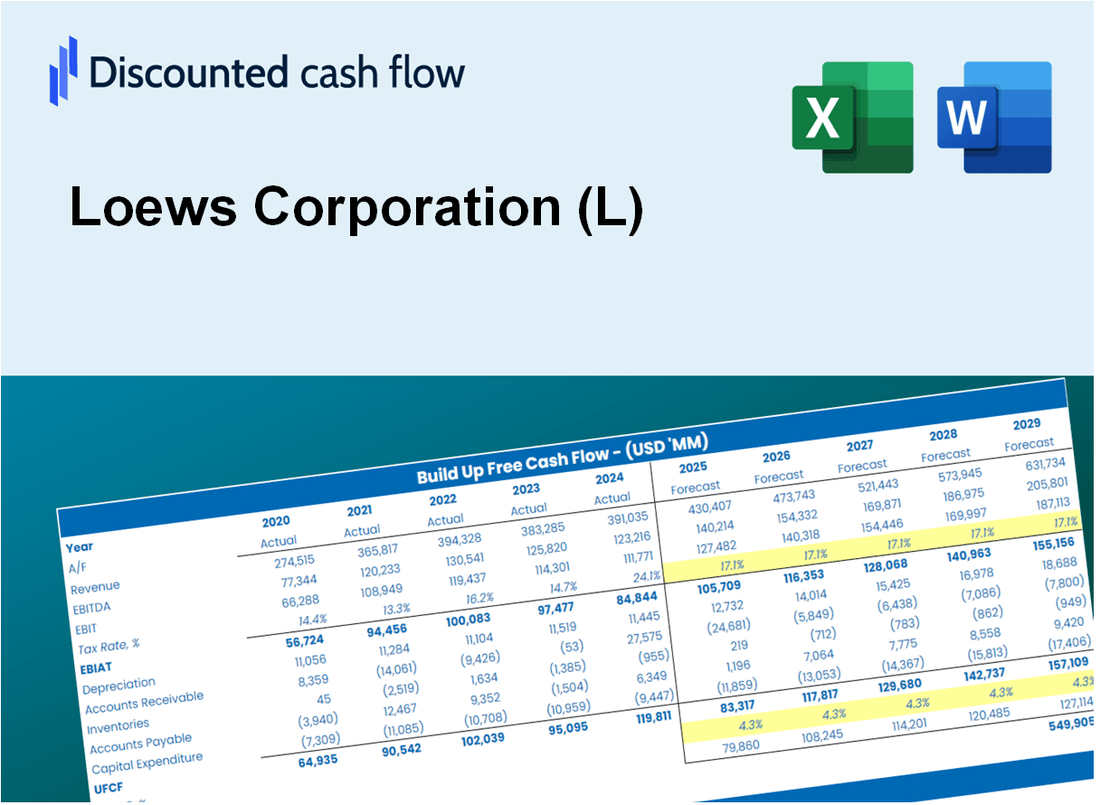
DCF -Bewertung der Loews Corporation (l) |
Fully Editable: Tailor To Your Needs In Excel Or Sheets
Professional Design: Trusted, Industry-Standard Templates
Investor-Approved Valuation Models
MAC/PC Compatible, Fully Unlocked
No Expertise Is Needed; Easy To Follow
Loews Corporation (L) Bundle
Erwerben Sie mit unserem hochmodernen DCF-Taschenrechner die Bewertungsanalyse für Ihre Loews Corporation (L)! Diese Excel -Vorlage wird mit realen (l) Daten vorinstalliert, sodass Sie Prognosen und Annahmen anpassen können, um den inneren Wert der Loews Corporation genau zu bestimmen.
Discounted Cash Flow (DCF) - (USD MM)
| Year | AY1 2020 |
AY2 2021 |
AY3 2022 |
AY4 2023 |
AY5 2024 |
FY1 2025 |
FY2 2026 |
FY3 2027 |
FY4 2028 |
FY5 2029 |
|---|---|---|---|---|---|---|---|---|---|---|
| Revenue | 13,794.0 | 13,727.0 | 14,044.0 | 15,678.0 | 17,510.0 | 18,610.7 | 19,780.5 | 21,023.9 | 22,345.4 | 23,750.1 |
| Revenue Growth, % | 0 | -0.48572 | 2.31 | 11.63 | 11.69 | 6.29 | 6.29 | 6.29 | 6.29 | 6.29 |
| EBITDA | -215.0 | 3,099.0 | 1,623.0 | 2,910.0 | 2,898.0 | 2,519.3 | 2,677.7 | 2,846.0 | 3,024.9 | 3,215.1 |
| EBITDA, % | -1.56 | 22.58 | 11.56 | 18.56 | 16.55 | 13.54 | 13.54 | 13.54 | 13.54 | 13.54 |
| Depreciation | 734.0 | 515.0 | 509.0 | 538.0 | 583.0 | 724.3 | 769.8 | 818.2 | 869.6 | 924.3 |
| Depreciation, % | 5.32 | 3.75 | 3.62 | 3.43 | 3.33 | 3.89 | 3.89 | 3.89 | 3.89 | 3.89 |
| EBIT | -949.0 | 2,584.0 | 1,114.0 | 2,372.0 | 2,315.0 | 1,795.1 | 1,907.9 | 2,027.8 | 2,155.3 | 2,290.8 |
| EBIT, % | -6.88 | 18.82 | 7.93 | 15.13 | 13.22 | 9.65 | 9.65 | 9.65 | 9.65 | 9.65 |
| Total Cash | 49,756.0 | 49,854.0 | 43,013.0 | 5,886.0 | 6,900.0 | 14,030.5 | 14,912.5 | 15,849.9 | 16,846.2 | 17,905.1 |
| Total Cash, percent | .0 | .0 | .0 | .0 | .0 | .0 | .0 | .0 | .0 | .0 |
| Account Receivables | .0 | .0 | .0 | 9,214.0 | 10,064.0 | 4,326.8 | 4,598.8 | 4,887.9 | 5,195.1 | 5,521.7 |
| Account Receivables, % | 0 | 0 | 0 | 58.77 | 57.48 | 23.25 | 23.25 | 23.25 | 23.25 | 23.25 |
| Inventories | .0 | .0 | .0 | .0 | .0 | .0 | .0 | .0 | .0 | .0 |
| Inventories, % | 0 | 0 | 0 | 0 | 0 | 0 | 0 | 0 | 0 | 0 |
| Accounts Payable | 92.0 | 90.0 | 133.0 | 79.0 | 110.0 | 126.6 | 134.6 | 143.0 | 152.0 | 161.6 |
| Accounts Payable, % | 0.66696 | 0.65564 | 0.94702 | 0.50389 | 0.62821 | 0.68035 | 0.68035 | 0.68035 | 0.68035 | 0.68035 |
| Capital Expenditure | -710.0 | -482.0 | -660.0 | -686.0 | -632.0 | -794.4 | -844.3 | -897.4 | -953.8 | -1,013.8 |
| Capital Expenditure, % | -5.15 | -3.51 | -4.7 | -4.38 | -3.61 | -4.27 | -4.27 | -4.27 | -4.27 | -4.27 |
| Tax Rate, % | 24.55 | 24.55 | 24.55 | 24.55 | 24.55 | 24.55 | 24.55 | 24.55 | 24.55 | 24.55 |
| EBITAT | -603.5 | 1,868.6 | 822.0 | 1,704.1 | 1,746.8 | 1,281.7 | 1,362.2 | 1,447.9 | 1,538.9 | 1,635.6 |
| Depreciation | ||||||||||
| Changes in Account Receivables | ||||||||||
| Changes in Inventories | ||||||||||
| Changes in Accounts Payable | ||||||||||
| Capital Expenditure | ||||||||||
| UFCF | -487.5 | 1,899.6 | 714.0 | -7,711.9 | 878.8 | 6,965.3 | 1,023.6 | 1,088.0 | 1,156.4 | 1,229.1 |
| WACC, % | 5.88 | 6.01 | 6.03 | 6 | 6.05 | 6 | 6 | 6 | 6 | 6 |
| PV UFCF | ||||||||||
| SUM PV UFCF | 10,230.7 | |||||||||
| Long Term Growth Rate, % | 2.00 | |||||||||
| Free cash flow (T + 1) | 1,254 | |||||||||
| Terminal Value | 31,372 | |||||||||
| Present Terminal Value | 23,447 | |||||||||
| Enterprise Value | 33,678 | |||||||||
| Net Debt | 8,403 | |||||||||
| Equity Value | 25,275 | |||||||||
| Diluted Shares Outstanding, MM | 221 | |||||||||
| Equity Value Per Share | 114.61 |
What You Will Get
- Real Loews Corporation Data: Preloaded financials – from revenue to EBIT – based on actual and projected figures.
- Full Customization: Adjust all critical parameters (yellow cells) like WACC, growth %, and tax rates.
- Instant Valuation Updates: Automatic recalculations to analyze the impact of changes on Loews Corporation’s fair value.
- Versatile Excel Template: Tailored for quick edits, scenario testing, and detailed projections.
- Time-Saving and Accurate: Skip building models from scratch while maintaining precision and flexibility.
Key Features
- Comprehensive Historical Data: Loews Corporation’s past financial statements and projected forecasts.
- Customizable Inputs: Adjust WACC, tax rates, revenue growth, and EBITDA margins to fit your analysis.
- Real-Time Valuation: Witness Loews Corporation’s intrinsic value update instantly.
- Intuitive Visual Outputs: Engaging dashboard charts illustrate valuation results and essential metrics.
- Designed for Precision: A reliable tool tailored for analysts, investors, and finance professionals.
How It Works
- Step 1: Download the prebuilt Excel template with Loews Corporation’s (L) data included.
- Step 2: Explore the pre-filled sheets and understand the key metrics.
- Step 3: Update forecasts and assumptions in the editable yellow cells (WACC, growth, margins).
- Step 4: Instantly view recalculated results, including Loews Corporation’s (L) intrinsic value.
- Step 5: Make informed investment decisions or generate reports using the outputs.
Why Choose the Loews Corporation (L) Calculator?
- Accuracy: Utilizes real Loews Corporation financials for precise data.
- Flexibility: Allows users to easily test and adjust inputs as needed.
- Time-Saving: Eliminate the need to create a DCF model from the ground up.
- Professional-Grade: Crafted with the precision and usability expected by CFOs.
- User-Friendly: Intuitive design makes it accessible for users without extensive financial modeling skills.
Who Should Use This Product?
- Investors: Evaluate Loews Corporation's (L) valuation before making investment decisions.
- CFOs and Financial Analysts: Enhance valuation methodologies and assess financial forecasts.
- Startup Founders: Discover how large corporations like Loews Corporation are appraised.
- Consultants: Provide comprehensive valuation analyses for clients in various sectors.
- Students and Educators: Utilize actual market data to learn and teach valuation strategies.
What the Template Contains
- Preloaded L Data: Historical and projected financial data, including revenue, EBIT, and capital expenditures.
- DCF and WACC Models: Professional-grade sheets for calculating intrinsic value and Weighted Average Cost of Capital.
- Editable Inputs: Yellow-highlighted cells for adjusting revenue growth, tax rates, and discount rates.
- Financial Statements: Comprehensive annual and quarterly financials for deeper analysis.
- Key Ratios: Profitability, leverage, and efficiency ratios to evaluate performance.
- Dashboard and Charts: Visual summaries of valuation outcomes and assumptions.
Disclaimer
All information, articles, and product details provided on this website are for general informational and educational purposes only. We do not claim any ownership over, nor do we intend to infringe upon, any trademarks, copyrights, logos, brand names, or other intellectual property mentioned or depicted on this site. Such intellectual property remains the property of its respective owners, and any references here are made solely for identification or informational purposes, without implying any affiliation, endorsement, or partnership.
We make no representations or warranties, express or implied, regarding the accuracy, completeness, or suitability of any content or products presented. Nothing on this website should be construed as legal, tax, investment, financial, medical, or other professional advice. In addition, no part of this site—including articles or product references—constitutes a solicitation, recommendation, endorsement, advertisement, or offer to buy or sell any securities, franchises, or other financial instruments, particularly in jurisdictions where such activity would be unlawful.
All content is of a general nature and may not address the specific circumstances of any individual or entity. It is not a substitute for professional advice or services. Any actions you take based on the information provided here are strictly at your own risk. You accept full responsibility for any decisions or outcomes arising from your use of this website and agree to release us from any liability in connection with your use of, or reliance upon, the content or products found herein.