
|
Latent View Analytics Limited (LatentView.NS) DCF -Bewertung |
Fully Editable: Tailor To Your Needs In Excel Or Sheets
Professional Design: Trusted, Industry-Standard Templates
Investor-Approved Valuation Models
MAC/PC Compatible, Fully Unlocked
No Expertise Is Needed; Easy To Follow
Latent View Analytics Limited (LATENTVIEW.NS) Bundle
Stürzen Sie Ihre Analyse und verbessern Sie die Präzision mit unserem DCF -Taschenrechner (LatentViewns)! Mithilfe realer Daten aus Latent View Analytics Limited und anpassbaren Annahmen ermöglicht dieses Tool die latente Sichtweise wie ein erfahrener Investor prognostizieren, analysieren und bewerten.
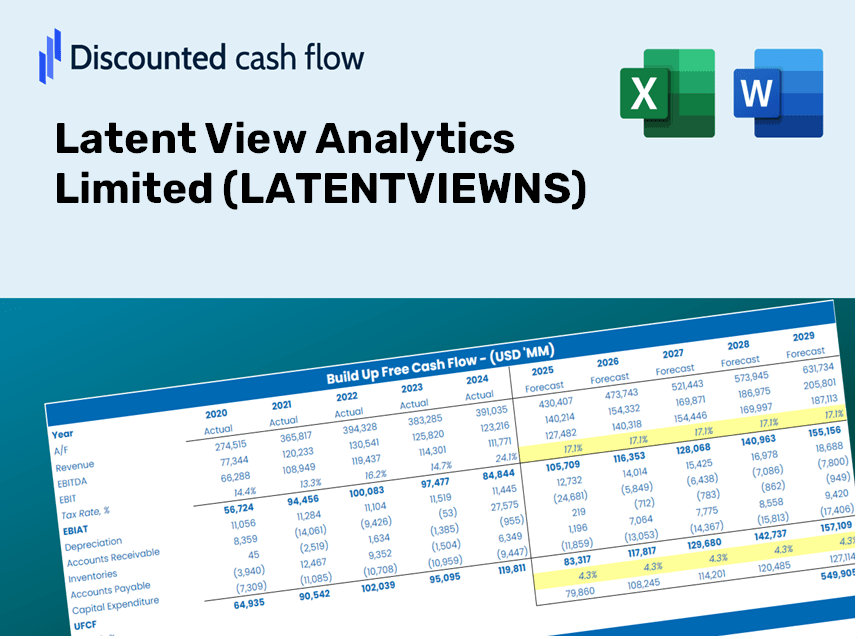
Discounted Cash Flow (DCF) - (USD MM)
| Year | AY1 2021 |
AY2 2022 |
AY3 2023 |
AY4 2024 |
AY5 2025 |
FY1 2026 |
FY2 2027 |
FY3 2028 |
FY4 2029 |
FY5 2030 |
|---|---|---|---|---|---|---|---|---|---|---|
| Revenue | 3,058.8 | 4,078.2 | 5,387.6 | 6,406.8 | 8,478.4 | 10,951.7 | 14,146.5 | 18,273.3 | 23,604.0 | 30,489.7 |
| Revenue Growth, % | 0 | 33.33 | 32.11 | 18.92 | 32.33 | 29.17 | 29.17 | 29.17 | 29.17 | 29.17 |
| EBITDA | 1,254.0 | 1,655.8 | 2,009.3 | 2,099.9 | 1,956.7 | 3,827.6 | 4,944.1 | 6,386.4 | 8,249.4 | 10,655.9 |
| EBITDA, % | 41 | 40.6 | 37.29 | 32.78 | 23.08 | 34.95 | 34.95 | 34.95 | 34.95 | 34.95 |
| Depreciation | 68.7 | 81.6 | 88.2 | 96.6 | 293.1 | 237.6 | 306.9 | 396.4 | 512.1 | 661.5 |
| Depreciation, % | 2.25 | 2 | 1.64 | 1.51 | 3.46 | 2.17 | 2.17 | 2.17 | 2.17 | 2.17 |
| EBIT | 1,185.3 | 1,574.2 | 1,921.1 | 2,003.3 | 1,663.6 | 3,590.0 | 4,637.2 | 5,990.0 | 7,737.4 | 9,994.5 |
| EBIT, % | 38.75 | 38.6 | 35.66 | 31.27 | 19.62 | 32.78 | 32.78 | 32.78 | 32.78 | 32.78 |
| Total Cash | 2,934.5 | 7,967.3 | 8,133.5 | 9,168.1 | 6,604.7 | 10,378.7 | 13,406.3 | 17,317.2 | 22,368.9 | 28,894.3 |
| Total Cash, percent | .0 | .0 | .0 | .0 | .0 | .0 | .0 | .0 | .0 | .0 |
| Account Receivables | 650.1 | 928.4 | 1,161.3 | 1,386.5 | 1,959.6 | 2,416.6 | 3,121.5 | 4,032.1 | 5,208.4 | 6,727.7 |
| Account Receivables, % | 21.25 | 22.77 | 21.56 | 21.64 | 23.11 | 22.07 | 22.07 | 22.07 | 22.07 | 22.07 |
| Inventories | .0 | -654.1 | -767.9 | .0 | .0 | -663.5 | -857.0 | -1,107.0 | -1,430.0 | -1,847.1 |
| Inventories, % | 0 | -16.04 | -14.25 | 0 | 0 | -6.06 | -6.06 | -6.06 | -6.06 | -6.06 |
| Accounts Payable | 34.0 | 42.8 | 38.1 | 99.5 | 197.8 | 147.9 | 191.1 | 246.8 | 318.9 | 411.9 |
| Accounts Payable, % | 1.11 | 1.05 | 0.70699 | 1.55 | 2.33 | 1.35 | 1.35 | 1.35 | 1.35 | 1.35 |
| Capital Expenditure | -18.4 | -65.4 | -32.2 | -46.2 | -161.9 | -119.0 | -153.7 | -198.6 | -256.5 | -331.3 |
| Capital Expenditure, % | -0.60187 | -1.6 | -0.59767 | -0.72064 | -1.91 | -1.09 | -1.09 | -1.09 | -1.09 | -1.09 |
| Tax Rate, % | 23.85 | 23.85 | 23.85 | 23.85 | 23.85 | 23.85 | 23.85 | 23.85 | 23.85 | 23.85 |
| EBITAT | 935.2 | 1,322.4 | 1,576.9 | 1,613.1 | 1,266.8 | 2,883.9 | 3,725.1 | 4,811.8 | 6,215.5 | 8,028.7 |
| Depreciation | ||||||||||
| Changes in Account Receivables | ||||||||||
| Changes in Inventories | ||||||||||
| Changes in Accounts Payable | ||||||||||
| Capital Expenditure | ||||||||||
| UFCF | 369.4 | 1,723.1 | 1,509.1 | 731.8 | 923.1 | 3,159.1 | 3,410.1 | 4,404.8 | 5,689.8 | 7,349.6 |
| WACC, % | 5.03 | 5.04 | 5.03 | 5.03 | 5.03 | 5.03 | 5.03 | 5.03 | 5.03 | 5.03 |
| PV UFCF | ||||||||||
| SUM PV UFCF | 20,324.9 | |||||||||
| Long Term Growth Rate, % | 4.00 | |||||||||
| Free cash flow (T + 1) | 7,644 | |||||||||
| Terminal Value | 739,806 | |||||||||
| Present Terminal Value | 578,742 | |||||||||
| Enterprise Value | 599,067 | |||||||||
| Net Debt | -688 | |||||||||
| Equity Value | 599,755 | |||||||||
| Diluted Shares Outstanding, MM | 207 | |||||||||
| Equity Value Per Share | 2,895.77 |
What You Will Receive
- Customizable Excel Template: A fully adjustable Excel-based DCF Calculator featuring pre-loaded financial data for LATENT VIEW Analytics Limited (LATENTVIEWNS).
- Accurate Data: Comprehensive historical data alongside forward-looking projections (highlighted in the yellow cells).
- Flexible Forecasting: Adjust assumptions such as revenue growth, EBITDA margin, and WACC with ease.
- Instant Calculations: Quickly observe how your inputs affect the valuation of LATENT VIEW Analytics Limited (LATENTVIEWNS).
- Professional Resource: Designed for use by investors, CFOs, consultants, and financial analysts.
- User-Centric Layout: Organized for clarity and straightforward navigation, complete with step-by-step guidance.
Key Features
- 🔍 Real-Time LATENTVIEWNS Financials: Access pre-filled historical and projected data for Latent View Analytics Limited.
- ✏️ Fully Customizable Inputs: Modify all essential parameters (yellow cells) such as WACC, growth %, and tax rates.
- 📊 Advanced DCF Valuation: Utilize built-in formulas to determine Latent View's intrinsic value using the Discounted Cash Flow method.
- ⚡ Immediate Insights: Quickly visualize Latent View's valuation following any adjustments made.
- Scenario Analysis: Conduct side-by-side comparisons of outcomes based on different financial assumptions.
How It Works
- Step 1: Download the Excel file.
- Step 2: Review the pre-filled data for Latent View Analytics Limited (LATENTVIEWNS) including both historical performance and projections.
- Step 3: Modify the key assumptions (highlighted in yellow) according to your analysis.
- Step 4: Observe the automatic recalculations reflecting Latent View Analytics Limited’s (LATENTVIEWNS) intrinsic value.
- Step 5: Utilize the results for your investment decisions or reporting needs.
Why Select Latent View Analytics Limited (LATENTVIEWNS)?
- Precision: Utilizes accurate financial data for reliable insights.
- Versatility: Allows users to explore and adjust inputs at will.
- Efficiency: Eliminate the need for constructing complex models from the ground up.
- Expert-Level: Created with the standards of top financial professionals in mind.
- Intuitive: Simple to navigate, making it accessible for users without deep modeling expertise.
Who Should Use This Product?
- Individual Investors: Make informed decisions about buying or selling Latent View Analytics Limited (LATENTVIEWNS) stock.
- Financial Analysts: Optimize valuation processes with pre-built financial models tailored for Latent View Analytics Limited (LATENTVIEWNS).
- Consultants: Provide clients with precise and timely valuation insights related to Latent View Analytics Limited (LATENTVIEWNS).
- Business Owners: Gain insights into how market leaders like Latent View Analytics Limited (LATENTVIEWNS) are valued to refine your own business strategy.
- Finance Students: Master valuation methods using real-world examples and data from Latent View Analytics Limited (LATENTVIEWNS).
Overview of the Template's Features
- In-Depth DCF Model: Customizable template featuring extensive valuation calculations.
- Current Financial Data: Latent View Analytics Limited’s historical and projected financials preloaded for your analysis.
- Adjustable Parameters: Modify WACC, growth rates, and tax assumptions to explore various scenarios.
- Comprehensive Financial Statements: Detailed annual and quarterly breakdowns for enhanced insights.
- Essential Ratios: Integrated analysis for profitability, efficiency, and leverage metrics.
- Interactive Dashboard with Visual Outputs: Charts and tables that present clear, actionable results.
Disclaimer
All information, articles, and product details provided on this website are for general informational and educational purposes only. We do not claim any ownership over, nor do we intend to infringe upon, any trademarks, copyrights, logos, brand names, or other intellectual property mentioned or depicted on this site. Such intellectual property remains the property of its respective owners, and any references here are made solely for identification or informational purposes, without implying any affiliation, endorsement, or partnership.
We make no representations or warranties, express or implied, regarding the accuracy, completeness, or suitability of any content or products presented. Nothing on this website should be construed as legal, tax, investment, financial, medical, or other professional advice. In addition, no part of this site—including articles or product references—constitutes a solicitation, recommendation, endorsement, advertisement, or offer to buy or sell any securities, franchises, or other financial instruments, particularly in jurisdictions where such activity would be unlawful.
All content is of a general nature and may not address the specific circumstances of any individual or entity. It is not a substitute for professional advice or services. Any actions you take based on the information provided here are strictly at your own risk. You accept full responsibility for any decisions or outcomes arising from your use of this website and agree to release us from any liability in connection with your use of, or reliance upon, the content or products found herein.