
|
Liberty Broadband Corporation (LBRDA) DCF -Bewertung |
Fully Editable: Tailor To Your Needs In Excel Or Sheets
Professional Design: Trusted, Industry-Standard Templates
Investor-Approved Valuation Models
MAC/PC Compatible, Fully Unlocked
No Expertise Is Needed; Easy To Follow
Liberty Broadband Corporation (LBRDA) Bundle
Erwerben Sie ein umfassendes Verständnis Ihrer Bewertungsanalyse Ihrer Liberty Broadband Corporation (LBRDA) mit unserem hochmodernen DCF-Taschenrechner! Diese Excel -Vorlage wird mit realen LBRDA -Daten vorinstalliert, sodass Sie Prognosen und Annahmen anpassen können, um den inneren Wert der Liberty Broadband Corporation genau zu bestimmen.
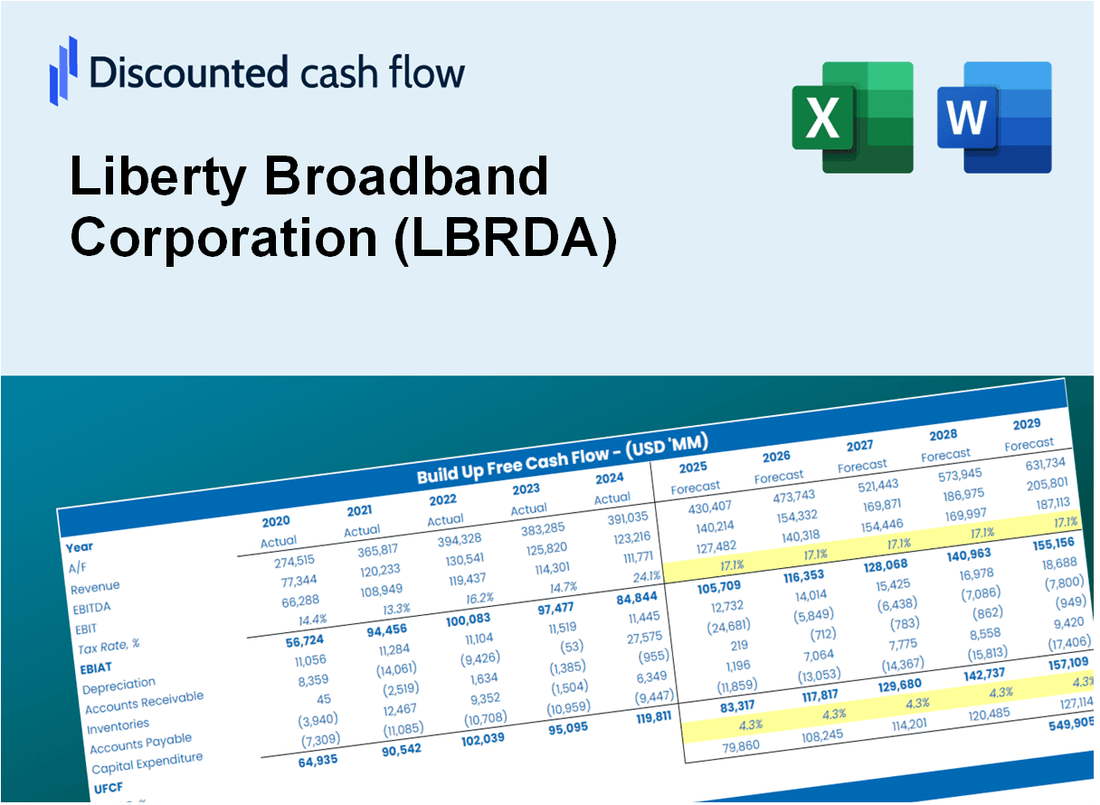
Discounted Cash Flow (DCF) - (USD MM)
| Year | AY1 2020 |
AY2 2021 |
AY3 2022 |
AY4 2023 |
AY5 2024 |
FY1 2025 |
FY2 2026 |
FY3 2027 |
FY4 2028 |
FY5 2029 |
|---|---|---|---|---|---|---|---|---|---|---|
| Revenue | 50.7 | 988.0 | 921.0 | 981.0 | 1,016.0 | 1,278.4 | 1,608.5 | 2,023.9 | 2,546.6 | 3,204.3 |
| Revenue Growth, % | 0 | 1848.49 | -6.78 | 6.52 | 3.57 | 25.83 | 25.83 | 25.83 | 25.83 | 25.83 |
| EBITDA | 671.2 | 264.0 | 290.0 | 1,324.0 | 1,483.0 | 915.9 | 1,152.4 | 1,450.0 | 1,824.5 | 2,295.6 |
| EBITDA, % | 1323.7 | 26.72 | 31.49 | 134.96 | 145.96 | 71.64 | 71.64 | 71.64 | 71.64 | 71.64 |
| Depreciation | 15.2 | 267.0 | 262.0 | 230.0 | 207.0 | 330.6 | 416.0 | 523.5 | 658.7 | 828.8 |
| Depreciation, % | 30.03 | 27.02 | 28.45 | 23.45 | 20.37 | 25.86 | 25.86 | 25.86 | 25.86 | 25.86 |
| EBIT | 656.0 | -3.0 | 28.0 | 1,094.0 | 1,276.0 | 774.0 | 973.9 | 1,225.4 | 1,541.9 | 1,940.1 |
| EBIT, % | 1293.67 | -0.30364 | 3.04 | 111.52 | 125.59 | 60.55 | 60.55 | 60.55 | 60.55 | 60.55 |
| Total Cash | 1,417.8 | 191.0 | 375.0 | 158.0 | 163.0 | 491.4 | 618.3 | 778.0 | 978.9 | 1,231.7 |
| Total Cash, percent | .0 | .0 | .0 | .0 | .0 | .0 | .0 | .0 | .0 | .0 |
| Account Receivables | 349.0 | 206.0 | 201.0 | 178.0 | 195.0 | 460.3 | 579.1 | 728.7 | 916.9 | 1,153.6 |
| Account Receivables, % | 688.28 | 20.85 | 21.82 | 18.14 | 19.19 | 36 | 36 | 36 | 36 | 36 |
| Inventories | .0 | .0 | .0 | .0 | .0 | .0 | .0 | .0 | .0 | .0 |
| Inventories, % | 0 | 0 | 0 | 0 | 0 | 0 | 0 | 0 | 0 | 0 |
| Accounts Payable | .0 | .0 | .0 | .0 | .0 | .0 | .0 | .0 | .0 | .0 |
| Accounts Payable, % | 0 | 0 | 0 | 0 | 0 | 0 | 0 | 0 | 0 | 0 |
| Capital Expenditure | -2.0 | -134.0 | -181.0 | -222.0 | -247.0 | -215.0 | -270.6 | -340.4 | -428.3 | -539.0 |
| Capital Expenditure, % | -3.94 | -13.56 | -19.65 | -22.63 | -24.31 | -16.82 | -16.82 | -16.82 | -16.82 | -16.82 |
| Tax Rate, % | 19.69 | 19.69 | 19.69 | 19.69 | 19.69 | 19.69 | 19.69 | 19.69 | 19.69 | 19.69 |
| EBITAT | 722.9 | -2.3 | 22.9 | 847.6 | 1,024.8 | 645.2 | 811.8 | 1,021.5 | 1,285.3 | 1,617.2 |
| Depreciation | ||||||||||
| Changes in Account Receivables | ||||||||||
| Changes in Inventories | ||||||||||
| Changes in Accounts Payable | ||||||||||
| Capital Expenditure | ||||||||||
| UFCF | 387.1 | 273.7 | 108.9 | 878.6 | 967.8 | 495.6 | 838.5 | 1,055.0 | 1,327.4 | 1,670.3 |
| WACC, % | 7.34 | 6.95 | 7.03 | 6.96 | 7 | 7.06 | 7.06 | 7.06 | 7.06 | 7.06 |
| PV UFCF | ||||||||||
| SUM PV UFCF | 4,252.7 | |||||||||
| Long Term Growth Rate, % | 2.00 | |||||||||
| Free cash flow (T + 1) | 1,704 | |||||||||
| Terminal Value | 33,698 | |||||||||
| Present Terminal Value | 23,964 | |||||||||
| Enterprise Value | 28,217 | |||||||||
| Net Debt | 3,665 | |||||||||
| Equity Value | 24,552 | |||||||||
| Diluted Shares Outstanding, MM | 143 | |||||||||
| Equity Value Per Share | 171.69 |
What You Will Get
- Real LBRDA Financials: Access to historical and forecasted data for precise valuation.
- Adjustable Inputs: Customize WACC, tax rates, revenue growth, and capital expenditures.
- Automatic Calculations: Intrinsic value and NPV are computed in real-time.
- Scenario Analysis: Explore various scenarios to assess Liberty Broadband’s future performance.
- Clear and Intuitive Design: Designed for professionals while remaining user-friendly for newcomers.
Key Features
- Comprehensive LBRDA Data: Pre-loaded with Liberty Broadband's historical financial performance and future projections.
- Customizable Input Options: Modify revenue growth rates, profit margins, WACC, tax rates, and capital expenditures as needed.
- Interactive Valuation Model: Automatically recalculates Net Present Value (NPV) and intrinsic value based on your custom inputs.
- Scenario Analysis: Develop various forecasting scenarios to evaluate different valuation results.
- User-Centric Interface: Intuitive, organized, and designed for both seasoned professionals and newcomers.
How It Works
- Step 1: Download the Excel file for Liberty Broadband Corporation (LBRDA).
- Step 2: Review the pre-filled financial data and forecasts for Liberty Broadband Corporation (LBRDA).
- Step 3: Modify key inputs such as revenue growth, WACC, and tax rates (highlighted cells).
- Step 4: Observe the DCF model update in real-time as you adjust your assumptions.
- Step 5: Analyze the results and leverage the findings for your investment strategies.
Why Choose This Calculator for Liberty Broadband Corporation (LBRDA)?
- Accurate Data: Utilize real Liberty Broadband financials for trustworthy valuation outcomes.
- Customizable: Tailor essential parameters like growth rates, WACC, and tax rates to align with your forecasts.
- Time-Saving: Pre-configured calculations save you the hassle of starting from the ground up.
- Professional-Grade Tool: Crafted for investors, analysts, and consultants in the telecommunications sector.
- User-Friendly: Clear layout and guided instructions ensure ease of use for everyone.
Who Should Use This Product?
- Investors: Accurately assess Liberty Broadband Corporation’s (LBRDA) fair value prior to making investment choices.
- CFOs: Utilize a professional-grade DCF model for financial reporting and analysis regarding Liberty Broadband Corporation (LBRDA).
- Consultants: Efficiently customize the template for valuation reports tailored to clients involving Liberty Broadband Corporation (LBRDA).
- Entrepreneurs: Acquire insights into financial modeling practices employed by leading companies like Liberty Broadband Corporation (LBRDA).
- Educators: Implement it as a teaching resource to illustrate valuation methodologies using Liberty Broadband Corporation (LBRDA) as a case study.
What the Template Contains
- Preloaded LBRDA Data: Historical and projected financial data, including revenue, EBIT, and capital expenditures.
- DCF and WACC Models: Professional-grade sheets for calculating intrinsic value and Weighted Average Cost of Capital.
- Editable Inputs: Yellow-highlighted cells for adjusting revenue growth, tax rates, and discount rates.
- Financial Statements: Comprehensive annual and quarterly financials for deeper analysis.
- Key Ratios: Profitability, leverage, and efficiency ratios to evaluate performance.
- Dashboard and Charts: Visual summaries of valuation outcomes and assumptions.
Disclaimer
All information, articles, and product details provided on this website are for general informational and educational purposes only. We do not claim any ownership over, nor do we intend to infringe upon, any trademarks, copyrights, logos, brand names, or other intellectual property mentioned or depicted on this site. Such intellectual property remains the property of its respective owners, and any references here are made solely for identification or informational purposes, without implying any affiliation, endorsement, or partnership.
We make no representations or warranties, express or implied, regarding the accuracy, completeness, or suitability of any content or products presented. Nothing on this website should be construed as legal, tax, investment, financial, medical, or other professional advice. In addition, no part of this site—including articles or product references—constitutes a solicitation, recommendation, endorsement, advertisement, or offer to buy or sell any securities, franchises, or other financial instruments, particularly in jurisdictions where such activity would be unlawful.
All content is of a general nature and may not address the specific circumstances of any individual or entity. It is not a substitute for professional advice or services. Any actions you take based on the information provided here are strictly at your own risk. You accept full responsibility for any decisions or outcomes arising from your use of this website and agree to release us from any liability in connection with your use of, or reliance upon, the content or products found herein.