
|
Liberty Global Plc (LBTYA) DCF -Bewertung |
Fully Editable: Tailor To Your Needs In Excel Or Sheets
Professional Design: Trusted, Industry-Standard Templates
Investor-Approved Valuation Models
MAC/PC Compatible, Fully Unlocked
No Expertise Is Needed; Easy To Follow
Liberty Global plc (LBTYA) Bundle
Entdecken Sie den wahren Wert von Liberty Global Plc (LBBYA) mit unserem fortschrittlichen DCF -Taschenrechner! Passen Sie die wichtigsten Annahmen an, erkunden Sie verschiedene Szenarien und untersuchen, wie sich Veränderungen auf die Bewertung der Liberty Global PLC (LBTYA) auswirken - alles innerhalb einer einzigen Excel -Vorlage.
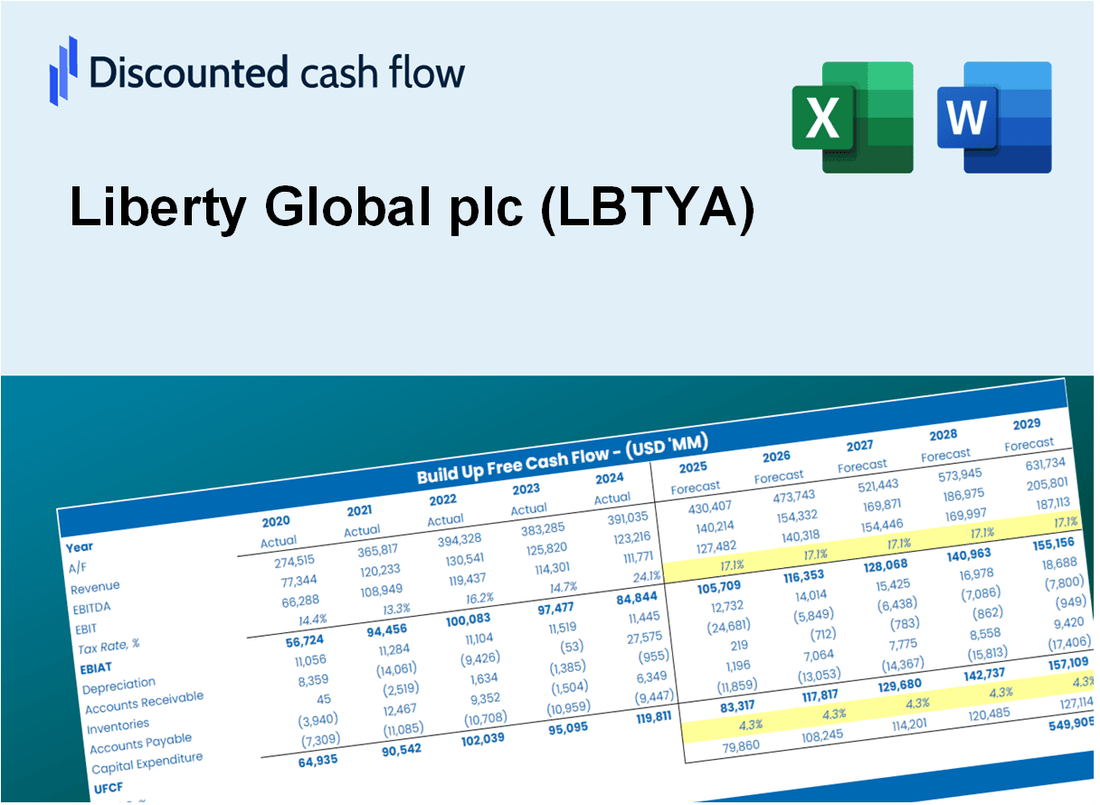
Discounted Cash Flow (DCF) - (USD MM)
| Year | AY1 2020 |
AY2 2021 |
AY3 2022 |
AY4 2023 |
AY5 2024 |
FY1 2025 |
FY2 2026 |
FY3 2027 |
FY4 2028 |
FY5 2029 |
|---|---|---|---|---|---|---|---|---|---|---|
| Revenue | 11,545.4 | 10,311.3 | 4,017.5 | 4,115.8 | 4,341.9 | 3,649.5 | 3,067.5 | 2,578.4 | 2,167.2 | 1,821.6 |
| Revenue Growth, % | 0 | -10.69 | -61.04 | 2.45 | 5.49 | -15.95 | -15.95 | -15.95 | -15.95 | -15.95 |
| EBITDA | 4,355.5 | 3,655.0 | 1,265.8 | 951.9 | 987.9 | 1,098.9 | 923.7 | 776.4 | 652.6 | 548.5 |
| EBITDA, % | 37.72 | 35.45 | 31.51 | 23.13 | 22.75 | 30.11 | 30.11 | 30.11 | 30.11 | 30.11 |
| Depreciation | 2,227.2 | 2,353.7 | 1,093.6 | 1,216.4 | 1,002.0 | 890.3 | 748.3 | 629.0 | 528.7 | 444.4 |
| Depreciation, % | 19.29 | 22.83 | 27.22 | 29.55 | 23.08 | 24.39 | 24.39 | 24.39 | 24.39 | 24.39 |
| EBIT | 2,128.3 | 1,301.3 | 172.2 | -264.5 | -14.1 | 208.7 | 175.4 | 147.4 | 123.9 | 104.2 |
| EBIT, % | 18.43 | 12.62 | 4.29 | -6.43 | -0.32474 | 5.72 | 5.72 | 5.72 | 5.72 | 5.72 |
| Total Cash | 3,076.2 | 3,395.1 | 4,729.2 | 3,400.6 | 2,151.9 | 2,129.5 | 1,789.9 | 1,504.5 | 1,264.6 | 1,062.9 |
| Total Cash, percent | .0 | .0 | .0 | .0 | .0 | .0 | .0 | .0 | .0 | .0 |
| Account Receivables | 1,105.8 | 969.8 | 865.6 | 447.1 | 505.8 | 460.1 | 386.8 | 325.1 | 273.2 | 229.7 |
| Account Receivables, % | 9.58 | 9.41 | 21.55 | 10.86 | 11.65 | 12.61 | 12.61 | 12.61 | 12.61 | 12.61 |
| Inventories | .0 | .0 | .0 | .0 | .0 | .0 | .0 | .0 | .0 | .0 |
| Inventories, % | 0 | 0 | 0 | 0 | 0 | 0 | 0 | 0 | 0 | 0 |
| Accounts Payable | 579.1 | 613.4 | 610.1 | 407.5 | 371.2 | 325.5 | 273.6 | 230.0 | 193.3 | 162.5 |
| Accounts Payable, % | 5.02 | 5.95 | 15.19 | 9.9 | 8.55 | 8.92 | 8.92 | 8.92 | 8.92 | 8.92 |
| Capital Expenditure | -1,292.8 | -1,408.0 | -891.3 | -921.9 | -908.5 | -659.5 | -554.4 | -466.0 | -391.7 | -329.2 |
| Capital Expenditure, % | -11.2 | -13.65 | -22.19 | -22.4 | -20.92 | -18.07 | -18.07 | -18.07 | -18.07 | -18.07 |
| Tax Rate, % | 13.62 | 13.62 | 13.62 | 13.62 | 13.62 | 13.62 | 13.62 | 13.62 | 13.62 | 13.62 |
| EBITAT | 1,923.9 | 1,247.9 | 215.3 | -311.0 | -12.2 | 197.3 | 165.8 | 139.4 | 117.1 | 98.5 |
| Depreciation | ||||||||||
| Changes in Account Receivables | ||||||||||
| Changes in Inventories | ||||||||||
| Changes in Accounts Payable | ||||||||||
| Capital Expenditure | ||||||||||
| UFCF | 2,331.6 | 2,363.9 | 518.5 | 199.4 | -13.7 | 428.0 | 381.2 | 320.4 | 269.3 | 226.4 |
| WACC, % | 5.91 | 6.13 | 6.3 | 6.3 | 5.74 | 6.08 | 6.08 | 6.08 | 6.08 | 6.08 |
| PV UFCF | ||||||||||
| SUM PV UFCF | 1,391.9 | |||||||||
| Long Term Growth Rate, % | 2.00 | |||||||||
| Free cash flow (T + 1) | 231 | |||||||||
| Terminal Value | 5,662 | |||||||||
| Present Terminal Value | 4,215 | |||||||||
| Enterprise Value | 5,607 | |||||||||
| Net Debt | 8,221 | |||||||||
| Equity Value | -2,614 | |||||||||
| Diluted Shares Outstanding, MM | 363 | |||||||||
| Equity Value Per Share | -7.20 |
What You Will Get
- Editable Forecast Inputs: Effortlessly modify assumptions (growth %, margins, WACC) to explore various scenarios.
- Real-World Data: Liberty Global plc’s financial data pre-filled to facilitate your analysis.
- Automatic DCF Outputs: The template computes Net Present Value (NPV) and intrinsic value automatically.
- Customizable and Professional: A refined Excel model that adjusts to your valuation requirements.
- Built for Analysts and Investors: Perfect for evaluating projections, confirming strategies, and enhancing efficiency.
Key Features
- Comprehensive Liberty Global Financials: Gain access to precise pre-loaded historical data and future forecasts.
- Adjustable Forecast Assumptions: Modify highlighted cells for WACC, growth rates, and profit margins as needed.
- Real-Time Calculations: Automatic updates for DCF, Net Present Value (NPV), and cash flow assessments.
- Interactive Dashboard: User-friendly charts and summaries to effectively visualize your valuation outcomes.
- Designed for All Skill Levels: A straightforward, intuitive layout tailored for investors, CFOs, and consultants.
How It Works
- Download the Template: Gain immediate access to the Excel-based LBTYA DCF Calculator.
- Input Your Assumptions: Modify the yellow-highlighted cells for growth rates, WACC, margins, and other variables.
- Instant Calculations: The model will automatically refresh Liberty Global’s intrinsic value.
- Test Scenarios: Experiment with various assumptions to assess potential valuation changes.
- Analyze and Decide: Utilize the results to inform your investment or financial analysis.
Why Choose This Calculator for Liberty Global plc (LBTYA)?
- Accuracy: Utilizes real Liberty Global financials for precise data.
- Flexibility: Tailored for users to experiment and adjust inputs as needed.
- Time-Saving: Eliminate the complexity of creating a DCF model from the ground up.
- Professional-Grade: Crafted with the expertise and usability expected at the CFO level.
- User-Friendly: Intuitive design makes it accessible for users without advanced financial modeling skills.
Who Should Use This Product?
- Finance Students: Understand the intricacies of valuation methods and apply them to real-world data.
- Academics: Utilize advanced financial models in your teaching or research related to Liberty Global plc (LBTYA).
- Investors: Validate your investment hypotheses and examine valuation results for Liberty Global plc (LBTYA).
- Analysts: Enhance your analysis process with a ready-to-use, customizable DCF model tailored for Liberty Global plc (LBTYA).
- Small Business Owners: Discover how major public companies like Liberty Global plc (LBTYA) are assessed and valued.
What the Template Contains
- Historical Data: Includes Liberty Global plc’s past financials and baseline forecasts.
- DCF and Levered DCF Models: Detailed templates to calculate Liberty Global plc’s intrinsic value.
- WACC Sheet: Pre-built calculations for Weighted Average Cost of Capital.
- Editable Inputs: Modify key drivers like growth rates, EBITDA %, and CAPEX assumptions.
- Quarterly and Annual Statements: A complete breakdown of Liberty Global plc’s financials.
- Interactive Dashboard: Visualize valuation results and projections dynamically.
Disclaimer
All information, articles, and product details provided on this website are for general informational and educational purposes only. We do not claim any ownership over, nor do we intend to infringe upon, any trademarks, copyrights, logos, brand names, or other intellectual property mentioned or depicted on this site. Such intellectual property remains the property of its respective owners, and any references here are made solely for identification or informational purposes, without implying any affiliation, endorsement, or partnership.
We make no representations or warranties, express or implied, regarding the accuracy, completeness, or suitability of any content or products presented. Nothing on this website should be construed as legal, tax, investment, financial, medical, or other professional advice. In addition, no part of this site—including articles or product references—constitutes a solicitation, recommendation, endorsement, advertisement, or offer to buy or sell any securities, franchises, or other financial instruments, particularly in jurisdictions where such activity would be unlawful.
All content is of a general nature and may not address the specific circumstances of any individual or entity. It is not a substitute for professional advice or services. Any actions you take based on the information provided here are strictly at your own risk. You accept full responsibility for any decisions or outcomes arising from your use of this website and agree to release us from any liability in connection with your use of, or reliance upon, the content or products found herein.