|
Logicmark, Inc. (LGMK) DCF -Bewertung |
Fully Editable: Tailor To Your Needs In Excel Or Sheets
Professional Design: Trusted, Industry-Standard Templates
Investor-Approved Valuation Models
MAC/PC Compatible, Fully Unlocked
No Expertise Is Needed; Easy To Follow
LogicMark, Inc. (LGMK) Bundle
Streamline Logicmark, Inc. (LGMK) Bewertung mit unserem benutzerfreundlichen DCF-Taschenrechner! Ausgestattet mit den tatsächlichen Logikmark -Finanzdaten und einstellbaren Prognoseparametern können Sie schnell verschiedene Szenarien untersuchen und in nur wenigen Minuten den beizulegenden Zeitwert von Logicmark ermitteln.
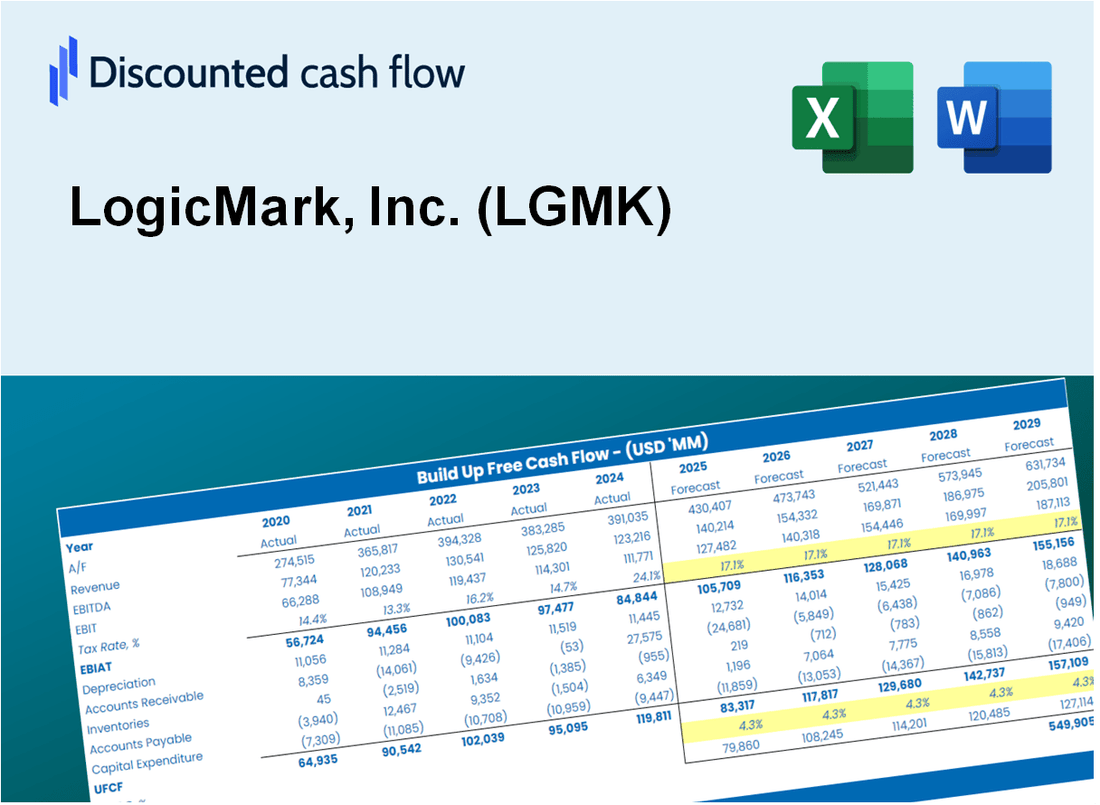
Discounted Cash Flow (DCF) - (USD MM)
| Year | AY1 2020 |
AY2 2021 |
AY3 2022 |
AY4 2023 |
AY5 2024 |
FY1 2025 |
FY2 2026 |
FY3 2027 |
FY4 2028 |
FY5 2029 |
|---|---|---|---|---|---|---|---|---|---|---|
| Revenue | 11.4 | 10.0 | 11.9 | 9.9 | 9.9 | 9.6 | 9.4 | 9.1 | 8.9 | 8.7 |
| Revenue Growth, % | 0 | -12.42 | 18.9 | -16.67 | -0.27838 | -2.62 | -2.62 | -2.62 | -2.62 | -2.62 |
| EBITDA | .2 | -2.2 | -6.1 | -6.6 | -6.1 | -3.8 | -3.7 | -3.6 | -3.5 | -3.4 |
| EBITDA, % | 2.11 | -22.31 | -51.21 | -66.15 | -61.2 | -39.75 | -39.75 | -39.75 | -39.75 | -39.75 |
| Depreciation | .8 | .8 | .8 | .9 | 1.6 | .9 | .9 | .9 | .9 | .8 |
| Depreciation, % | 7.23 | 7.89 | 6.95 | 9.51 | 16.26 | 9.57 | 9.57 | 9.57 | 9.57 | 9.57 |
| EBIT | -.6 | -3.0 | -6.9 | -7.5 | -7.7 | -4.8 | -4.6 | -4.5 | -4.4 | -4.3 |
| EBIT, % | -5.12 | -30.2 | -58.16 | -75.67 | -77.47 | -49.32 | -49.32 | -49.32 | -49.32 | -49.32 |
| Total Cash | 4.4 | 12.0 | 7.0 | 6.4 | 3.8 | 5.8 | 5.6 | 5.5 | 5.3 | 5.2 |
| Total Cash, percent | .0 | .0 | .0 | .0 | .0 | .0 | .0 | .0 | .0 | .0 |
| Account Receivables | .1 | .1 | .4 | .0 | .0 | .1 | .1 | .1 | .1 | .1 |
| Account Receivables, % | 1.17 | 0.98531 | 3.38 | 0.13744 | 0.04398107 | 1.14 | 1.14 | 1.14 | 1.14 | 1.14 |
| Inventories | .8 | 1.2 | 1.7 | 1.5 | 1.0 | 1.1 | 1.1 | 1.1 | 1.1 | 1.0 |
| Inventories, % | 6.71 | 12.35 | 14.65 | 14.88 | 10.59 | 11.83 | 11.83 | 11.83 | 11.83 | 11.83 |
| Accounts Payable | 2.7 | .5 | .7 | .9 | .8 | 1.0 | 1.0 | .9 | .9 | .9 |
| Accounts Payable, % | 24.02 | 4.91 | 5.65 | 9.08 | 7.58 | 10.25 | 10.25 | 10.25 | 10.25 | 10.25 |
| Capital Expenditure | .0 | .0 | -1.3 | -1.4 | -1.5 | -.8 | -.7 | -.7 | -.7 | -.7 |
| Capital Expenditure, % | 0 | 0 | -10.98 | -13.83 | -14.75 | -7.91 | -7.91 | -7.91 | -7.91 | -7.91 |
| Tax Rate, % | -0.11059 | -0.11059 | -0.11059 | -0.11059 | -0.11059 | -0.11059 | -0.11059 | -0.11059 | -0.11059 | -0.11059 |
| EBITAT | -.6 | -3.1 | -7.1 | -7.4 | -7.7 | -4.7 | -4.6 | -4.5 | -4.4 | -4.3 |
| Depreciation | ||||||||||
| Changes in Account Receivables | ||||||||||
| Changes in Inventories | ||||||||||
| Changes in Accounts Payable | ||||||||||
| Capital Expenditure | ||||||||||
| UFCF | 2.1 | -5.0 | -8.2 | -6.9 | -7.2 | -4.5 | -4.4 | -4.3 | -4.2 | -4.1 |
| WACC, % | 10.77 | 10.77 | 10.77 | 10.77 | 10.77 | 10.77 | 10.77 | 10.77 | 10.77 | 10.77 |
| PV UFCF | ||||||||||
| SUM PV UFCF | -16.2 | |||||||||
| Long Term Growth Rate, % | 2.00 | |||||||||
| Free cash flow (T + 1) | -4 | |||||||||
| Terminal Value | -48 | |||||||||
| Present Terminal Value | -29 | |||||||||
| Enterprise Value | -45 | |||||||||
| Net Debt | -4 | |||||||||
| Equity Value | -41 | |||||||||
| Diluted Shares Outstanding, MM | 1 | |||||||||
| Equity Value Per Share | -64.67 |
What You Will Get
- Real LGMK Financial Data: Pre-filled with LogicMark's historical and projected data for precise analysis.
- Fully Editable Template: Modify key inputs like revenue growth, WACC, and EBITDA % with ease.
- Automatic Calculations: See LogicMark’s intrinsic value update instantly based on your changes.
- Professional Valuation Tool: Designed for investors, analysts, and consultants seeking accurate DCF results.
- User-Friendly Design: Simple structure and clear instructions for all experience levels.
Key Features
- Comprehensive DCF Calculator: Features detailed unlevered and levered DCF valuation models tailored for LogicMark, Inc. (LGMK).
- WACC Calculator: Comes with a pre-structured Weighted Average Cost of Capital sheet that allows for customizable inputs.
- Adjustable Forecast Assumptions: Easily modify growth rates, capital expenditures, and discount rates to suit your analysis.
- Integrated Financial Ratios: Evaluate profitability, leverage, and efficiency ratios specifically for LogicMark, Inc. (LGMK).
- Interactive Dashboard and Charts: Visual representations that summarize essential valuation metrics for straightforward analysis.
How It Works
- Step 1: Download the prebuilt Excel template featuring LogicMark, Inc.'s (LGMK) data.
- Step 2: Review the pre-filled sheets to familiarize yourself with the essential metrics.
- Step 3: Modify forecasts and assumptions in the editable yellow cells (WACC, growth, margins).
- Step 4: Instantly see the recalculated results, including LogicMark, Inc.'s (LGMK) intrinsic value.
- Step 5: Utilize the outputs to make informed investment decisions or create reports.
Why Choose This Calculator?
- User-Friendly Interface: Tailored for both novices and seasoned professionals.
- Customizable Inputs: Adjust parameters to suit your specific analysis needs.
- Real-Time Feedback: Observe immediate changes to LogicMark, Inc.'s (LGMK) valuation as you modify inputs.
- Preloaded Data: Comes equipped with LogicMark, Inc.'s (LGMK) actual financial metrics for swift evaluations.
- Relied Upon by Experts: Utilized by investors and analysts to guide strategic decisions.
Who Should Use This Product?
- Investors: Assess LogicMark, Inc.'s (LGMK) market position before making investment decisions.
- CFOs and Financial Analysts: Optimize valuation methodologies and evaluate financial forecasts.
- Startup Founders: Discover the valuation strategies employed by established companies like LogicMark, Inc.
- Consultants: Create comprehensive valuation reports for clients utilizing LogicMark, Inc. as a case study.
- Students and Educators: Incorporate actual market data to enhance learning and application of valuation principles.
What the Template Contains
- Operating and Balance Sheet Data: Pre-filled LogicMark, Inc. (LGMK) historical data and forecasts, including revenue, EBITDA, EBIT, and capital expenditures.
- WACC Calculation: A dedicated sheet for Weighted Average Cost of Capital (WACC), including parameters like Beta, risk-free rate, and share price.
- DCF Valuation (Unlevered and Levered): Editable Discounted Cash Flow models showing intrinsic value with detailed calculations.
- Financial Statements: Pre-loaded financial statements (annual and quarterly) to support analysis.
- Key Ratios: Includes profitability, leverage, and efficiency ratios for LogicMark, Inc. (LGMK).
- Dashboard and Charts: Visual summary of valuation outputs and assumptions to analyze results easily.
Disclaimer
All information, articles, and product details provided on this website are for general informational and educational purposes only. We do not claim any ownership over, nor do we intend to infringe upon, any trademarks, copyrights, logos, brand names, or other intellectual property mentioned or depicted on this site. Such intellectual property remains the property of its respective owners, and any references here are made solely for identification or informational purposes, without implying any affiliation, endorsement, or partnership.
We make no representations or warranties, express or implied, regarding the accuracy, completeness, or suitability of any content or products presented. Nothing on this website should be construed as legal, tax, investment, financial, medical, or other professional advice. In addition, no part of this site—including articles or product references—constitutes a solicitation, recommendation, endorsement, advertisement, or offer to buy or sell any securities, franchises, or other financial instruments, particularly in jurisdictions where such activity would be unlawful.
All content is of a general nature and may not address the specific circumstances of any individual or entity. It is not a substitute for professional advice or services. Any actions you take based on the information provided here are strictly at your own risk. You accept full responsibility for any decisions or outcomes arising from your use of this website and agree to release us from any liability in connection with your use of, or reliance upon, the content or products found herein.