
|
Interlink Electronics, Inc. (Link) DCF -Bewertung |
Fully Editable: Tailor To Your Needs In Excel Or Sheets
Professional Design: Trusted, Industry-Standard Templates
Investor-Approved Valuation Models
MAC/PC Compatible, Fully Unlocked
No Expertise Is Needed; Easy To Follow
Interlink Electronics, Inc. (LINK) Bundle
Sparen Sie Zeit und verbessern Sie die Präzision mit unserem (Link) DCF -Taschenrechner! Durch die Verwendung realer Daten von Interlink Electronics, Inc. und anpassbaren Annahmen ermöglichen dieses Tool Sie, wie ein Experteninvestor prognostizieren, analysieren und value (link).
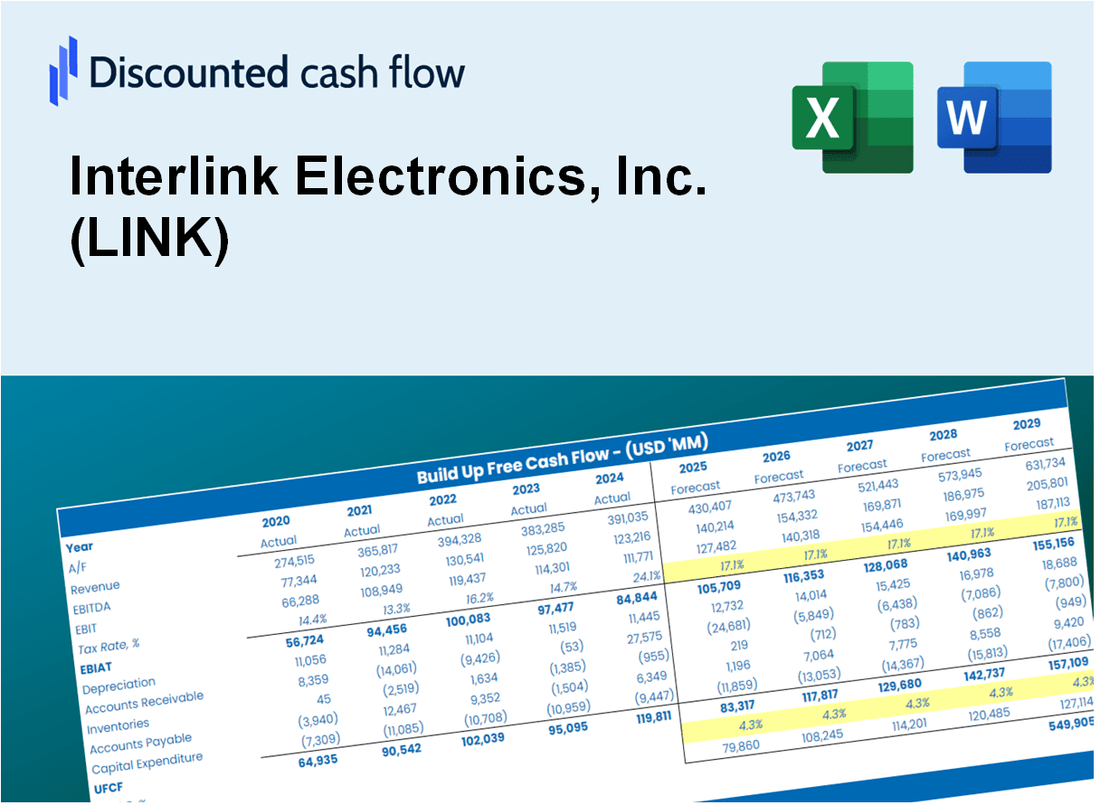
Discounted Cash Flow (DCF) - (USD MM)
| Year | AY1 2020 |
AY2 2021 |
AY3 2022 |
AY4 2023 |
AY5 2024 |
FY1 2025 |
FY2 2026 |
FY3 2027 |
FY4 2028 |
FY5 2029 |
|---|---|---|---|---|---|---|---|---|---|---|
| Revenue | 6.9 | 7.5 | 7.5 | 13.9 | 11.7 | 14.0 | 16.7 | 20.0 | 23.9 | 28.6 |
| Revenue Growth, % | 0 | 8.57 | 0.20059 | 86.04 | -16.22 | 19.65 | 19.65 | 19.65 | 19.65 | 19.65 |
| EBITDA | .1 | .2 | -.4 | .4 | -1.2 | -.2 | -.3 | -.3 | -.4 | -.5 |
| EBITDA, % | 1.6 | 2.5 | -5.7 | 3.04 | -9.92 | -1.69 | -1.69 | -1.69 | -1.69 | -1.69 |
| Depreciation | .5 | .3 | .2 | .9 | .9 | .8 | .9 | 1.1 | 1.3 | 1.6 |
| Depreciation, % | 7.35 | 3.56 | 3.22 | 6.19 | 7.64 | 5.59 | 5.59 | 5.59 | 5.59 | 5.59 |
| EBIT | -.4 | -.1 | -.7 | -.4 | -2.1 | -1.0 | -1.2 | -1.5 | -1.7 | -2.1 |
| EBIT, % | -5.75 | -1.06 | -8.91 | -3.15 | -17.55 | -7.28 | -7.28 | -7.28 | -7.28 | -7.28 |
| Total Cash | 6.1 | 10.8 | 10.1 | 4.3 | 3.0 | 9.6 | 11.5 | 13.8 | 16.5 | 19.8 |
| Total Cash, percent | .0 | .0 | .0 | .0 | .0 | .0 | .0 | .0 | .0 | .0 |
| Account Receivables | 1.1 | 1.1 | 1.2 | 2.2 | 1.6 | 2.1 | 2.5 | 3.0 | 3.6 | 4.3 |
| Account Receivables, % | 16.16 | 14.44 | 15.72 | 15.55 | 13.8 | 15.13 | 15.13 | 15.13 | 15.13 | 15.13 |
| Inventories | .9 | .8 | 2.1 | 2.5 | 2.0 | 2.4 | 2.9 | 3.5 | 4.1 | 5.0 |
| Inventories, % | 12.57 | 10.89 | 28.19 | 17.76 | 17.2 | 17.32 | 17.32 | 17.32 | 17.32 | 17.32 |
| Accounts Payable | .2 | .3 | .3 | .5 | .6 | .6 | .7 | .8 | .9 | 1.1 |
| Accounts Payable, % | 3.41 | 4.52 | 3.64 | 3.33 | 4.91 | 3.96 | 3.96 | 3.96 | 3.96 | 3.96 |
| Capital Expenditure | -.1 | -.2 | .0 | -.1 | -.2 | -.2 | -.2 | -.3 | -.3 | -.4 |
| Capital Expenditure, % | -1.31 | -2.13 | -0.56052 | -0.88235 | -1.52 | -1.28 | -1.28 | -1.28 | -1.28 | -1.28 |
| Tax Rate, % | -1.38 | -1.38 | -1.38 | -1.38 | -1.38 | -1.38 | -1.38 | -1.38 | -1.38 | -1.38 |
| EBITAT | -2.5 | -.4 | -.4 | -.6 | -2.1 | -.9 | -1.1 | -1.4 | -1.6 | -1.9 |
| Depreciation | ||||||||||
| Changes in Account Receivables | ||||||||||
| Changes in Inventories | ||||||||||
| Changes in Accounts Payable | ||||||||||
| Capital Expenditure | ||||||||||
| UFCF | -3.8 | -.2 | -1.7 | -1.0 | -.2 | -1.3 | -1.2 | -1.4 | -1.7 | -2.0 |
| WACC, % | 6.91 | 6.91 | 6.87 | 6.91 | 6.91 | 6.9 | 6.9 | 6.9 | 6.9 | 6.9 |
| PV UFCF | ||||||||||
| SUM PV UFCF | -6.2 | |||||||||
| Long Term Growth Rate, % | 4.00 | |||||||||
| Free cash flow (T + 1) | -2 | |||||||||
| Terminal Value | -73 | |||||||||
| Present Terminal Value | -53 | |||||||||
| Enterprise Value | -59 | |||||||||
| Net Debt | -2 | |||||||||
| Equity Value | -57 | |||||||||
| Diluted Shares Outstanding, MM | 10 | |||||||||
| Equity Value Per Share | -5.78 |
What You Will Receive
- Pre-Filled Financial Model: Interlink Electronics’ actual data allows for accurate DCF valuation.
- Comprehensive Forecast Control: Modify revenue growth, profit margins, WACC, and other essential drivers.
- Real-Time Calculations: Automatic updates provide immediate insights as you make adjustments.
- Professional-Grade Template: A polished Excel file crafted for high-quality valuation.
- Flexible and Reusable: Designed for adaptability, enabling repeated application for in-depth forecasts.
Key Features
- Accurate Financial Data: Access reliable pre-loaded historical performance and future forecasts for Interlink Electronics, Inc. (LINK).
- Adjustable Forecast Parameters: Modify highlighted cells for key inputs like WACC, growth rates, and profit margins.
- Real-Time Calculations: Automatic updates for DCF, Net Present Value (NPV), and cash flow assessments.
- User-Friendly Dashboard: Clear charts and summaries to help you visualize valuation outcomes.
- Suitable for All Levels: An intuitive design tailored for investors, CFOs, and consultants alike.
How It Works
- Step 1: Download the prebuilt Excel template featuring Interlink Electronics, Inc. (LINK) data.
- Step 2: Review the pre-filled sheets to familiarize yourself with the essential metrics.
- Step 3: Modify forecasts and assumptions in the editable yellow cells (WACC, growth, margins).
- Step 4: Immediately see the recalculated results, including Interlink Electronics, Inc. (LINK)'s intrinsic value.
- Step 5: Make well-informed investment decisions or create reports based on the outputs.
Why Choose This Calculator for Interlink Electronics, Inc. (LINK)?
- Designed for Experts: A sophisticated tool utilized by financial analysts, CFOs, and industry consultants.
- Accurate Data: Interlink’s historical and forecasted financials are preloaded for precision.
- Forecast Scenarios: Effortlessly simulate various projections and assumptions.
- Comprehensive Outputs: Automatically computes intrinsic value, NPV, and essential metrics.
- User-Friendly: Detailed instructions lead you through each step of the process.
Who Should Use Interlink Electronics, Inc. (LINK)?
- Investors: Evaluate Interlink’s market position before making investment decisions.
- CFOs and Financial Analysts: Enhance valuation methodologies and analyze financial forecasts.
- Startup Founders: Discover how technology firms like Interlink are appraised in the market.
- Consultants: Provide comprehensive valuation assessments for client projects.
- Students and Educators: Utilize current data to learn and teach valuation strategies effectively.
What the Template Contains
- Preloaded LINK Data: Historical and projected financial data, including revenue, EBIT, and capital expenditures.
- DCF and WACC Models: Professional-grade sheets for calculating intrinsic value and Weighted Average Cost of Capital.
- Editable Inputs: Yellow-highlighted cells for adjusting revenue growth, tax rates, and discount rates.
- Financial Statements: Comprehensive annual and quarterly financials for deeper analysis.
- Key Ratios: Profitability, leverage, and efficiency ratios to evaluate performance.
- Dashboard and Charts: Visual summaries of valuation outcomes and assumptions.
Disclaimer
All information, articles, and product details provided on this website are for general informational and educational purposes only. We do not claim any ownership over, nor do we intend to infringe upon, any trademarks, copyrights, logos, brand names, or other intellectual property mentioned or depicted on this site. Such intellectual property remains the property of its respective owners, and any references here are made solely for identification or informational purposes, without implying any affiliation, endorsement, or partnership.
We make no representations or warranties, express or implied, regarding the accuracy, completeness, or suitability of any content or products presented. Nothing on this website should be construed as legal, tax, investment, financial, medical, or other professional advice. In addition, no part of this site—including articles or product references—constitutes a solicitation, recommendation, endorsement, advertisement, or offer to buy or sell any securities, franchises, or other financial instruments, particularly in jurisdictions where such activity would be unlawful.
All content is of a general nature and may not address the specific circumstances of any individual or entity. It is not a substitute for professional advice or services. Any actions you take based on the information provided here are strictly at your own risk. You accept full responsibility for any decisions or outcomes arising from your use of this website and agree to release us from any liability in connection with your use of, or reliance upon, the content or products found herein.