
|
Londonmetric Property Plc (LMP.L) DCF -Bewertung |
Fully Editable: Tailor To Your Needs In Excel Or Sheets
Professional Design: Trusted, Industry-Standard Templates
Investor-Approved Valuation Models
MAC/PC Compatible, Fully Unlocked
No Expertise Is Needed; Easy To Follow
LondonMetric Property Plc (LMP.L) Bundle
Entdecken Sie das finanzielle Potenzial von LondonMetric Property PLC (LMPL) mit unserem benutzerfreundlichen DCF-Taschenrechner! Geben Sie Ihre Prognosen für Wachstum, Margen und Kosten ein, um den inneren Wert der Londonmetric Property Plc (LMPL) zu berechnen und Ihre Anlagestrategie zu verbessern.
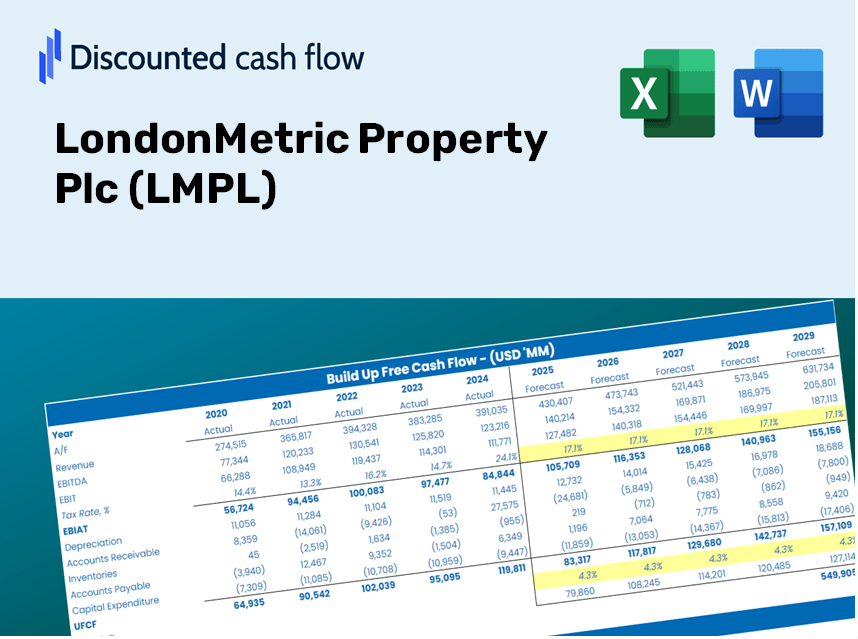
Discounted Cash Flow (DCF) - (USD MM)
| Year | AY1 2021 |
AY2 2022 |
AY3 2023 |
AY4 2024 |
AY5 2025 |
FY1 2026 |
FY2 2027 |
FY3 2028 |
FY4 2029 |
FY5 2030 |
|---|---|---|---|---|---|---|---|---|---|---|
| Revenue | 122.2 | 133.2 | 136.4 | 178.0 | 396.7 | 537.4 | 728.1 | 986.4 | 1,336.3 | 1,810.4 |
| Revenue Growth, % | 0 | 9 | 2.4 | 30.5 | 122.87 | 35.48 | 35.48 | 35.48 | 35.48 | 35.48 |
| EBITDA | 110.2 | 116.2 | 119.1 | 161.7 | 468.3 | 489.7 | 663.4 | 898.7 | 1,217.6 | 1,649.5 |
| EBITDA, % | 90.18 | 87.24 | 87.32 | 90.84 | 118.05 | 91.12 | 91.12 | 91.12 | 91.12 | 91.12 |
| Depreciation | .7 | .5 | .6 | .7 | .6 | 2.1 | 2.8 | 3.8 | 5.2 | 7.0 |
| Depreciation, % | 0.57283 | 0.37538 | 0.43988 | 0.39326 | 0.15125 | 0.38652 | 0.38652 | 0.38652 | 0.38652 | 0.38652 |
| EBIT | 109.5 | 115.7 | 118.5 | 161.0 | 467.7 | 487.8 | 660.8 | 895.2 | 1,212.8 | 1,643.1 |
| EBIT, % | 89.61 | 86.86 | 86.88 | 90.45 | 117.9 | 90.76 | 90.76 | 90.76 | 90.76 | 90.76 |
| Total Cash | 51.4 | 51.3 | 32.6 | 111.9 | 41.8 | 191.2 | 259.0 | 350.9 | 475.4 | 644.1 |
| Total Cash, percent | .0 | .0 | .0 | .0 | .0 | .0 | .0 | .0 | .0 | .0 |
| Account Receivables | 4.8 | 5.7 | 4.2 | 10.9 | 13.7 | 22.4 | 30.4 | 41.2 | 55.8 | 75.5 |
| Account Receivables, % | 3.93 | 4.28 | 3.08 | 6.12 | 3.45 | 4.17 | 4.17 | 4.17 | 4.17 | 4.17 |
| Inventories | .0 | .0 | 1.1 | .0 | 1.1 | 1.2 | 1.6 | 2.1 | 2.9 | 3.9 |
| Inventories, % | 0 | 0 | 0.80645 | 0 | 0.27729 | 0.21675 | 0.21675 | 0.21675 | 0.21675 | 0.21675 |
| Accounts Payable | 4.6 | 12.2 | 12.9 | 5.7 | 3.7 | 28.5 | 38.6 | 52.3 | 70.9 | 96.0 |
| Accounts Payable, % | 3.76 | 9.16 | 9.46 | 3.2 | 0.93269 | 5.3 | 5.3 | 5.3 | 5.3 | 5.3 |
| Capital Expenditure | -25.6 | -51.0 | -16.9 | -5.8 | -32.9 | -89.4 | -121.1 | -164.1 | -222.3 | -301.2 |
| Capital Expenditure, % | -20.95 | -38.29 | -12.39 | -3.26 | -8.29 | -16.64 | -16.64 | -16.64 | -16.64 | -16.64 |
| Tax Rate, % | 1.39 | 1.39 | 1.39 | 1.39 | 1.39 | 1.39 | 1.39 | 1.39 | 1.39 | 1.39 |
| EBITAT | 112.2 | 118.9 | 120.7 | 159.3 | 461.2 | 485.4 | 657.5 | 890.8 | 1,206.8 | 1,635.0 |
| Depreciation | ||||||||||
| Changes in Account Receivables | ||||||||||
| Changes in Inventories | ||||||||||
| Changes in Accounts Payable | ||||||||||
| Capital Expenditure | ||||||||||
| UFCF | 87.1 | 75.1 | 105.5 | 141.4 | 423.0 | 414.0 | 541.0 | 732.9 | 992.9 | 1,345.1 |
| WACC, % | 7.33 | 7.33 | 7.33 | 7.31 | 7.3 | 7.32 | 7.32 | 7.32 | 7.32 | 7.32 |
| PV UFCF | ||||||||||
| SUM PV UFCF | 3,141.7 | |||||||||
| Long Term Growth Rate, % | 2.00 | |||||||||
| Free cash flow (T + 1) | 1,372 | |||||||||
| Terminal Value | 25,787 | |||||||||
| Present Terminal Value | 18,113 | |||||||||
| Enterprise Value | 21,254 | |||||||||
| Net Debt | 2,058 | |||||||||
| Equity Value | 19,196 | |||||||||
| Diluted Shares Outstanding, MM | 2,046 | |||||||||
| Equity Value Per Share | 938.27 |
Your Benefits
- Customizable Excel Template: A fully adaptable Excel-based DCF Calculator featuring pre-loaded real LMPL financial data.
- Actual Market Data: Access to historical figures and forward-looking projections (highlighted in the yellow cells).
- Flexible Forecasting: Adjust key assumptions such as revenue growth, EBITDA %, and WACC as needed.
- Real-Time Calculations: Immediately observe how your inputs influence the valuation of LondonMetric Property Plc (LMPL).
- Professional-Grade Tool: Designed specifically for investors, CFOs, consultants, and financial analysts.
- Intuitive Design: Organized for straightforward navigation and ease of use, accompanied by clear step-by-step guidance.
Key Features
- Pre-Loaded Data: Historical financial statements and pre-filled forecasts for LondonMetric Property Plc (LMPL).
- Fully Adjustable Inputs: Customize WACC, tax rates, revenue growth, and EBITDA margins to suit your analysis.
- Instant Results: View the recalculated intrinsic value of LondonMetric Property Plc (LMPL) in real time.
- Clear Visual Outputs: Dashboard charts illustrate valuation results and critical metrics effectively.
- Built for Accuracy: A professional-grade tool designed for analysts, investors, and finance professionals.
How It Functions
- Download: Obtain the pre-designed Excel file featuring LondonMetric Property Plc's (LMPL) financial data.
- Customize: Modify forecasts, including revenue growth, EBITDA %, and WACC for your analysis.
- Update Automatically: Enjoy real-time updates for intrinsic value and NPV calculations.
- Test Scenarios: Generate various projections and quickly assess different outcomes.
- Make Decisions: Leverage the valuation results to inform your investment approach.
Why Opt for This Calculator?
- Reliable Data: Up-to-date LondonMetric Property Plc (LMPL) financials provide trustworthy valuation outcomes.
- Customizable Features: Modify essential parameters such as growth rates, WACC, and tax rates to align with your forecasts.
- Efficiency Boost: Built-in calculations save you the hassle of starting from the ground up.
- Professional Tool: Tailored for investors, analysts, and property consultants.
- Easy to Use: User-friendly design and clear, step-by-step guidance make it accessible for everyone.
Who Can Benefit from LondonMetric Property Plc (LMPL)?
- Real Estate Investors: Make informed decisions with a reliable valuation tool tailored for property assets.
- Financial Analysts: Streamline your workflow with a customizable DCF model designed for real estate.
- Consultants: Effortlessly modify the template for impactful client presentations or property reports.
- Property Enthusiasts: Enhance your knowledge of valuation methods using practical, real estate-focused examples.
- Educators and Students: Utilize it as a hands-on resource in finance and real estate courses.
Contents of the Template
- Pre-Filled Data: Contains historical financials and forecasts for LondonMetric Property Plc (LMPL).
- Discounted Cash Flow Model: Editable DCF valuation model featuring automatic calculations.
- Weighted Average Cost of Capital (WACC): A dedicated worksheet for calculating WACC based on user-defined inputs.
- Key Financial Ratios: Evaluate LondonMetric's profitability, efficiency, and leverage metrics.
- Customizable Inputs: Easily modify revenue growth, profit margins, and tax rates.
- Concise Dashboard: Visualizations and tables summarizing the essential valuation outcomes.
Disclaimer
All information, articles, and product details provided on this website are for general informational and educational purposes only. We do not claim any ownership over, nor do we intend to infringe upon, any trademarks, copyrights, logos, brand names, or other intellectual property mentioned or depicted on this site. Such intellectual property remains the property of its respective owners, and any references here are made solely for identification or informational purposes, without implying any affiliation, endorsement, or partnership.
We make no representations or warranties, express or implied, regarding the accuracy, completeness, or suitability of any content or products presented. Nothing on this website should be construed as legal, tax, investment, financial, medical, or other professional advice. In addition, no part of this site—including articles or product references—constitutes a solicitation, recommendation, endorsement, advertisement, or offer to buy or sell any securities, franchises, or other financial instruments, particularly in jurisdictions where such activity would be unlawful.
All content is of a general nature and may not address the specific circumstances of any individual or entity. It is not a substitute for professional advice or services. Any actions you take based on the information provided here are strictly at your own risk. You accept full responsibility for any decisions or outcomes arising from your use of this website and agree to release us from any liability in connection with your use of, or reliance upon, the content or products found herein.