
|
Makrotech Developers Limited (Lodha.NS) DCF -Bewertung |
Fully Editable: Tailor To Your Needs In Excel Or Sheets
Professional Design: Trusted, Industry-Standard Templates
Investor-Approved Valuation Models
MAC/PC Compatible, Fully Unlocked
No Expertise Is Needed; Easy To Follow
Macrotech Developers Limited (LODHA.NS) Bundle
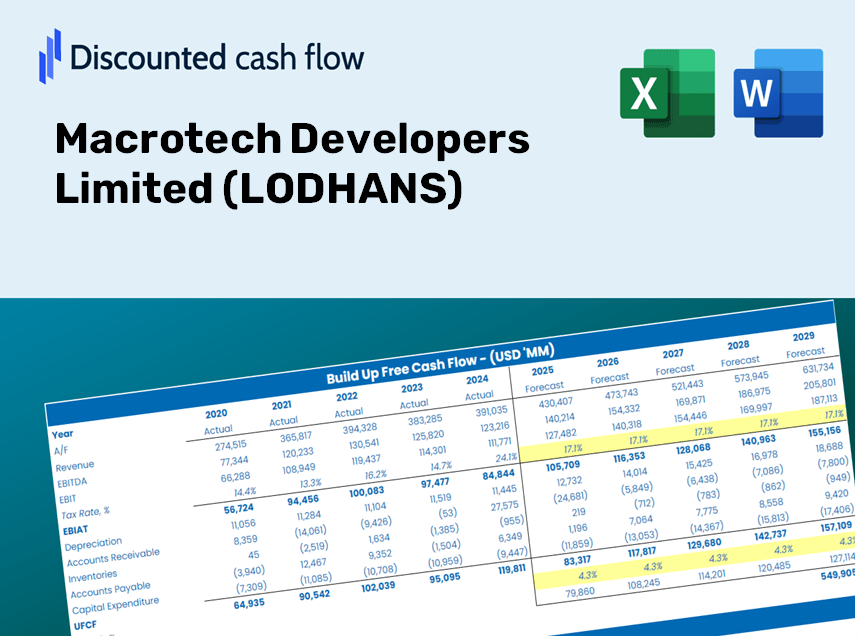
Möchten Sie den inneren Wert von Makrotech -Entwicklern beurteilen? Unser (Lodhans) DCF-Taschenrechner integriert reale Daten mit umfangreichen Anpassungsfunktionen, sodass Sie Prognosen anpassen und Ihre Anlagestrategien verbessern können.
What You Will Receive
- Adjustable Forecast Inputs: Effortlessly modify assumptions (growth %, margins, WACC) to explore various scenarios.
- Authentic Data: Macrotech Developers Limited's (LODHANS) financial information pre-filled to kickstart your analysis.
- Automated DCF Calculations: The template computes Net Present Value (NPV) and intrinsic value for you.
- Tailored and Professional: A sophisticated Excel model that adapts to your valuation requirements.
- Designed for Analysts and Investors: Perfect for evaluating projections, validating strategies, and enhancing efficiency.
Key Features of Macrotech Developers Limited (LODHANS)
- Accurate Financial Data: Gain access to pre-loaded historical financial data and forward-looking projections for informed decision-making.
- Flexible Forecast Assumptions: Modify highlighted fields such as WACC, growth rates, and profit margins to suit your analysis.
- Real-Time Calculations: Enjoy automatic updates for DCF, Net Present Value (NPV), and cash flow evaluations.
- User-Friendly Dashboard: Navigate through clear charts and summaries for an enhanced visualization of your valuation outcomes.
- Designed for All Experience Levels: An intuitive layout tailored for investors, CFOs, and consultants, whether seasoned or new to the field.
How It Works
- Step 1: Download the Excel file.
- Step 2: Examine the pre-filled data for Macrotech Developers Limited (LODHANS), including both historical and projected figures.
- Step 3: Modify the essential assumptions (highlighted in yellow) according to your analysis.
- Step 4: Observe the automatic recalculations reflecting Macrotech Developers Limited's (LODHANS) intrinsic value.
- Step 5: Utilize the results for your investment strategies or reporting needs.
Why Choose the Macrotech Developers Limited (LODHANS) Calculator?
- All-in-One Solution: Combines DCF, WACC, and financial ratio analyses for comprehensive evaluation.
- Flexible Inputs: Modify the yellow-highlighted cells to explore different investment scenarios.
- In-Depth Analysis: Automatically computes Macrotech Developers Limited’s intrinsic value and Net Present Value.
- Preloaded Information: Access historical and projected data for a solid foundation.
- Expert-Level Precision: Tailored for financial analysts, investors, and business consultants focused on LODHANS.
Who Can Benefit from This Product?
- Institutional Investors: Develop comprehensive and trustworthy valuation models for LODHANS portfolio assessments.
- Corporate Finance Departments: Evaluate valuation scenarios to inform strategic decisions within the organization.
- Consultants and Financial Advisors: Equip clients with precise valuation insights related to LODHANS.
- Students and Educators: Leverage real-time data to enhance financial modeling skills in academic settings.
- Real Estate Enthusiasts: Gain insights into how companies like Macrotech Developers Limited are appraised in the real estate market.
Contents of the Template
- Pre-Filled DCF Model: Financial data for Macrotech Developers Limited (LODHANS) preloaded for immediate analysis.
- WACC Calculator: Comprehensive calculations for the Weighted Average Cost of Capital.
- Financial Ratios: Assess Macrotech’s profitability, leverage, and operational efficiency.
- Editable Inputs: Tailor assumptions such as growth rates, profit margins, and capital expenditures to suit your analysis.
- Financial Statements: Access annual and quarterly reports for thorough evaluation.
- Interactive Dashboard: Visualize essential valuation metrics and outcomes with ease.
Disclaimer
All information, articles, and product details provided on this website are for general informational and educational purposes only. We do not claim any ownership over, nor do we intend to infringe upon, any trademarks, copyrights, logos, brand names, or other intellectual property mentioned or depicted on this site. Such intellectual property remains the property of its respective owners, and any references here are made solely for identification or informational purposes, without implying any affiliation, endorsement, or partnership.
We make no representations or warranties, express or implied, regarding the accuracy, completeness, or suitability of any content or products presented. Nothing on this website should be construed as legal, tax, investment, financial, medical, or other professional advice. In addition, no part of this site—including articles or product references—constitutes a solicitation, recommendation, endorsement, advertisement, or offer to buy or sell any securities, franchises, or other financial instruments, particularly in jurisdictions where such activity would be unlawful.
All content is of a general nature and may not address the specific circumstances of any individual or entity. It is not a substitute for professional advice or services. Any actions you take based on the information provided here are strictly at your own risk. You accept full responsibility for any decisions or outcomes arising from your use of this website and agree to release us from any liability in connection with your use of, or reliance upon, the content or products found herein.