
|
Logicbio Therapeutics, Inc. (Logc) DCF -Bewertung |
Fully Editable: Tailor To Your Needs In Excel Or Sheets
Professional Design: Trusted, Industry-Standard Templates
Investor-Approved Valuation Models
MAC/PC Compatible, Fully Unlocked
No Expertise Is Needed; Easy To Follow
LogicBio Therapeutics, Inc. (LOGC) Bundle
Maximieren Sie die Effizienz und verbessern Sie die Präzision mit unserem DCF -Taschenrechner (logc)! Mithilfe von Daten und anpassbaren Annahmen von Logicbio Therapeutics und anpassbare Annahmen befindet Sie sich wie ein erfahrener Investor prognostizieren, analysieren und beurteilen (logC).
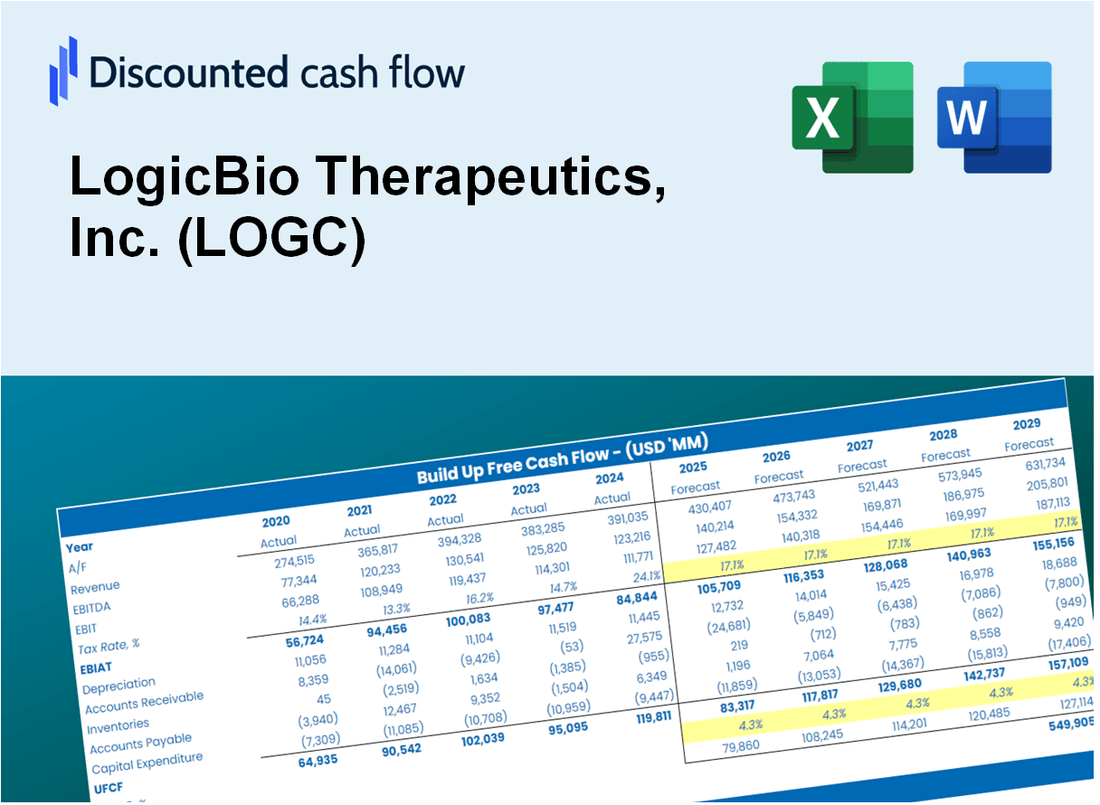
Discounted Cash Flow (DCF) - (USD MM)
| Year | AY1 2020 |
AY2 2021 |
AY3 2022 |
AY4 2023 |
AY5 2024 |
FY1 2025 |
FY2 2026 |
FY3 2027 |
FY4 2028 |
FY5 2029 |
|---|---|---|---|---|---|---|---|---|---|---|
| Revenue | 2,541.0 | 2,085.0 | 571.0 | 287.0 | 43.0 | 18.8 | 8.2 | 3.6 | 1.6 | .7 |
| Revenue Growth, % | 0 | -17.95 | -72.61 | -49.74 | -85.02 | -56.33 | -56.33 | -56.33 | -56.33 | -56.33 |
| EBITDA | -619.0 | -358.0 | -392.0 | -324.0 | -78.0 | -11.6 | -5.1 | -2.2 | -1.0 | -.4 |
| EBITDA, % | -24.36 | -17.17 | -68.65 | -112.89 | -181.4 | -62.04 | -62.04 | -62.04 | -62.04 | -62.04 |
| Depreciation | 12.0 | 9.0 | 6.0 | 4.0 | 1.0 | .2 | .1 | .0 | .0 | .0 |
| Depreciation, % | 0.47226 | 0.43165 | 1.05 | 1.39 | 2.33 | 1.13 | 1.13 | 1.13 | 1.13 | 1.13 |
| EBIT | -631.0 | -367.0 | -398.0 | -328.0 | -79.0 | -11.7 | -5.1 | -2.2 | -1.0 | -.4 |
| EBIT, % | -24.83 | -17.6 | -69.7 | -114.29 | -183.72 | -62.43 | -62.43 | -62.43 | -62.43 | -62.43 |
| Total Cash | 2,129.0 | 1,159.0 | 719.0 | 382.0 | 149.0 | 16.5 | 7.2 | 3.1 | 1.4 | .6 |
| Total Cash, percent | .0 | .0 | .0 | .0 | .0 | .0 | .0 | .0 | .0 | .0 |
| Account Receivables | 83.0 | 17.0 | 14.0 | 7.0 | .0 | .3 | .1 | .1 | .0 | .0 |
| Account Receivables, % | 3.27 | 0.81535 | 2.45 | 2.44 | 0 | 1.79 | 1.79 | 1.79 | 1.79 | 1.79 |
| Inventories | -2.2 | -2.2 | .0 | .0 | .0 | .0 | .0 | .0 | .0 | .0 |
| Inventories, % | -0.08677686 | -0.10341 | 0 | 0 | 0 | -0.03803643 | -0.03803643 | -0.03803643 | -0.03803643 | -0.03803643 |
| Accounts Payable | 434.0 | 67.0 | 53.0 | 30.0 | .0 | 1.5 | .7 | .3 | .1 | .1 |
| Accounts Payable, % | 17.08 | 3.21 | 9.28 | 10.45 | 0 | 8.01 | 8.01 | 8.01 | 8.01 | 8.01 |
| Capital Expenditure | -2.0 | -2.0 | -2.0 | -3.0 | .0 | -.1 | .0 | .0 | .0 | .0 |
| Capital Expenditure, % | -0.07870917 | -0.09592326 | -0.35026 | -1.05 | 0 | -0.31404 | -0.31404 | -0.31404 | -0.31404 | -0.31404 |
| Tax Rate, % | -8.7 | -8.7 | -8.7 | -8.7 | -8.7 | -8.7 | -8.7 | -8.7 | -8.7 | -8.7 |
| EBITAT | -632.7 | -377.5 | -399.0 | -333.3 | -85.9 | -11.7 | -5.1 | -2.2 | -1.0 | -.4 |
| Depreciation | ||||||||||
| Changes in Account Receivables | ||||||||||
| Changes in Inventories | ||||||||||
| Changes in Accounts Payable | ||||||||||
| Capital Expenditure | ||||||||||
| UFCF | -269.5 | -671.5 | -408.2 | -348.3 | -107.9 | -10.4 | -5.7 | -2.5 | -1.1 | -.5 |
| WACC, % | 13.1 | 13.1 | 13.1 | 13.1 | 13.1 | 13.1 | 13.1 | 13.1 | 13.1 | 13.1 |
| PV UFCF | ||||||||||
| SUM PV UFCF | -16.3 | |||||||||
| Long Term Growth Rate, % | 2.00 | |||||||||
| Free cash flow (T + 1) | 0 | |||||||||
| Terminal Value | -4 | |||||||||
| Present Terminal Value | -2 | |||||||||
| Enterprise Value | -19 | |||||||||
| Net Debt | -66 | |||||||||
| Equity Value | 47 | |||||||||
| Diluted Shares Outstanding, MM | 26 | |||||||||
| Equity Value Per Share | 1.84 |
What You Will Get
- Editable Excel Template: A fully customizable Excel-based DCF Calculator featuring pre-filled financial data for LogicBio Therapeutics, Inc. (LOGC).
- Real-World Data: Access to historical data and forward-looking estimates (highlighted in the yellow cells).
- Forecast Flexibility: Adjust key forecast assumptions such as revenue growth, EBITDA %, and WACC.
- Automatic Calculations: Quickly observe how your inputs affect the valuation of LogicBio Therapeutics, Inc. (LOGC).
- Professional Tool: Designed for investors, CFOs, consultants, and financial analysts.
- User-Friendly Design: Organized for clarity and ease of use, complete with step-by-step instructions.
Key Features
- Comprehensive Data: LogicBio’s historical financials and projected forecasts are readily available.
- Customizable Parameters: Modify WACC, tax rates, revenue growth, and EBITDA margins as needed.
- Real-Time Insights: Observe LogicBio’s intrinsic value update instantly.
- Intuitive Visualizations: Dashboard graphs illustrate valuation outcomes and essential metrics.
- Designed for Precision: A reliable tool tailored for analysts, investors, and financial professionals.
How It Works
- 1. Access the Template: Download and open the Excel file containing LogicBio Therapeutics, Inc.'s preloaded data.
- 2. Modify Assumptions: Adjust key parameters such as growth rates, WACC, and capital expenditures.
- 3. Analyze Results Instantly: The DCF model automatically computes intrinsic value and NPV.
- 4. Explore Scenarios: Evaluate various forecasts to understand different valuation outcomes.
- 5. Present with Assurance: Share professional valuation insights to back your strategic decisions.
Why Choose This Calculator for LogicBio Therapeutics, Inc. (LOGC)?
- User-Friendly Interface: Perfectly crafted for both novices and seasoned professionals.
- Customizable Parameters: Easily adjust inputs to suit your specific analysis needs.
- Real-Time Adjustments: Observe immediate updates to LogicBio's valuation as you change inputs.
- Preloaded Data: Comes equipped with LogicBio's current financial information for swift evaluations.
- Preferred by Experts: Utilized by investors and analysts for making well-informed choices.
Who Should Use LogicBio Therapeutics, Inc. (LOGC)?
- Investors: Gain insights into the potential of gene therapy investments with our comprehensive analysis tools.
- Biotech Analysts: Streamline your research with pre-built models tailored for evaluating biotech companies.
- Healthcare Consultants: Easily modify reports and presentations to showcase the impact of LogicBio's innovations.
- Life Sciences Enthusiasts: Enhance your knowledge of genetic medicine and its market implications through detailed case studies.
- Academics and Students: Utilize our resources as a hands-on learning tool in biotechnology and pharmacology courses.
What the Template Contains
- Pre-Filled Data: Includes LogicBio Therapeutics’ historical financials and forecasts.
- Discounted Cash Flow Model: Editable DCF valuation model with automatic calculations.
- Weighted Average Cost of Capital (WACC): A dedicated sheet for calculating WACC based on custom inputs.
- Key Financial Ratios: Analyze LogicBio Therapeutics’ profitability, efficiency, and leverage.
- Customizable Inputs: Edit revenue growth, margins, and tax rates with ease.
- Clear Dashboard: Charts and tables summarizing key valuation results.
Disclaimer
All information, articles, and product details provided on this website are for general informational and educational purposes only. We do not claim any ownership over, nor do we intend to infringe upon, any trademarks, copyrights, logos, brand names, or other intellectual property mentioned or depicted on this site. Such intellectual property remains the property of its respective owners, and any references here are made solely for identification or informational purposes, without implying any affiliation, endorsement, or partnership.
We make no representations or warranties, express or implied, regarding the accuracy, completeness, or suitability of any content or products presented. Nothing on this website should be construed as legal, tax, investment, financial, medical, or other professional advice. In addition, no part of this site—including articles or product references—constitutes a solicitation, recommendation, endorsement, advertisement, or offer to buy or sell any securities, franchises, or other financial instruments, particularly in jurisdictions where such activity would be unlawful.
All content is of a general nature and may not address the specific circumstances of any individual or entity. It is not a substitute for professional advice or services. Any actions you take based on the information provided here are strictly at your own risk. You accept full responsibility for any decisions or outcomes arising from your use of this website and agree to release us from any liability in connection with your use of, or reliance upon, the content or products found herein.