
|
London Stock Exchange Group PLC (LSEG.L) DCF -Bewertung |
Fully Editable: Tailor To Your Needs In Excel Or Sheets
Professional Design: Trusted, Industry-Standard Templates
Investor-Approved Valuation Models
MAC/PC Compatible, Fully Unlocked
No Expertise Is Needed; Easy To Follow
London Stock Exchange Group plc (LSEG.L) Bundle
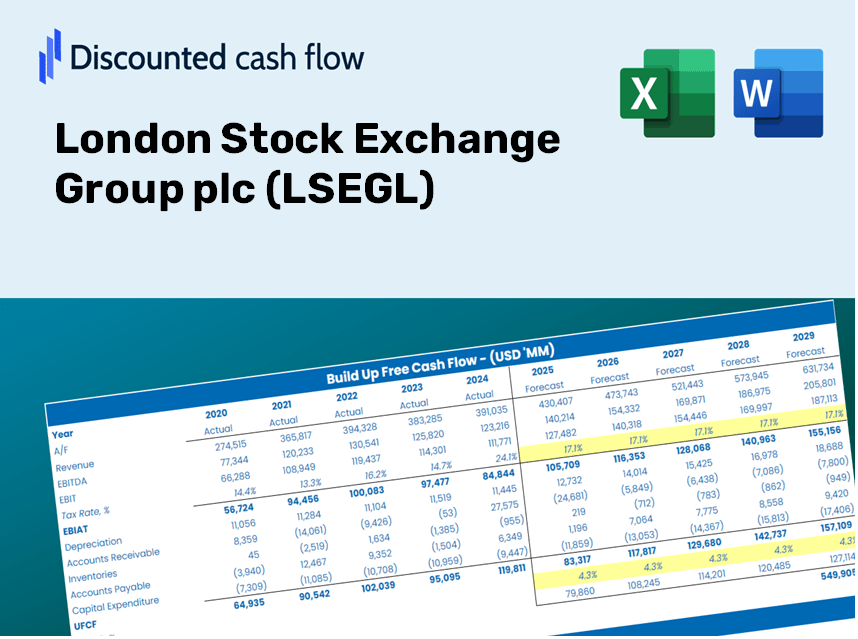
Gewinnen Sie mit unserem ausgeklügelten DCF -Taschenrechner Einblick in Ihre Londoner Börsengruppe PLC (LSEGL) -Schanganalyse! Diese Excel -Vorlage wird mit genauen (LSEGL-) Daten vorinstalliert, sodass Sie Prognosen und Annahmen anpassen können, um den inneren Wert der Londoner Börsegruppe PLC mit Präzision zu bestimmen.
Discounted Cash Flow (DCF) - (USD MM)
| Year | AY1 2020 |
AY2 2021 |
AY3 2022 |
AY4 2023 |
AY5 2024 |
FY1 2025 |
FY2 2026 |
FY3 2027 |
FY4 2028 |
FY5 2029 |
|---|---|---|---|---|---|---|---|---|---|---|
| Revenue | 2,030.0 | 6,535.0 | 7,743.0 | 8,379.0 | 8,858.0 | 11,790.3 | 15,693.4 | 20,888.5 | 27,803.5 | 37,007.5 |
| Revenue Growth, % | 0 | 221.92 | 18.49 | 8.21 | 5.72 | 33.1 | 33.1 | 33.1 | 33.1 | 33.1 |
| EBITDA | 884.0 | 2,957.0 | 3,550.0 | 3,892.0 | 4,139.0 | 5,372.1 | 7,150.5 | 9,517.6 | 12,668.3 | 16,862.0 |
| EBITDA, % | 43.55 | 45.25 | 45.85 | 46.45 | 46.73 | 45.56 | 45.56 | 45.56 | 45.56 | 45.56 |
| Depreciation | 340.0 | 1,570.0 | 1,893.0 | 2,143.0 | 2,216.0 | 2,731.0 | 3,635.0 | 4,838.4 | 6,440.1 | 8,572.0 |
| Depreciation, % | 16.75 | 24.02 | 24.45 | 25.58 | 25.02 | 23.16 | 23.16 | 23.16 | 23.16 | 23.16 |
| EBIT | 544.0 | 1,387.0 | 1,657.0 | 1,749.0 | 1,923.0 | 2,641.2 | 3,515.5 | 4,679.2 | 6,228.3 | 8,290.0 |
| EBIT, % | 26.8 | 21.22 | 21.4 | 20.87 | 21.71 | 22.4 | 22.4 | 22.4 | 22.4 | 22.4 |
| Total Cash | 1,785.0 | 2,665.0 | 3,435.0 | 3,580.0 | 2,133.0 | 5,656.5 | 7,529.1 | 10,021.5 | 13,339.0 | 17,754.7 |
| Total Cash, percent | .0 | .0 | .0 | .0 | .0 | .0 | .0 | .0 | .0 | .0 |
| Account Receivables | 416.0 | 815.0 | 1,138.0 | 1,812.0 | 1,240.0 | 1,963.9 | 2,614.1 | 3,479.4 | 4,631.2 | 6,164.4 |
| Account Receivables, % | 20.49 | 12.47 | 14.7 | 21.63 | 14 | 16.66 | 16.66 | 16.66 | 16.66 | 16.66 |
| Inventories | .0 | .0 | .0 | .0 | 203.0 | 54.0 | 71.9 | 95.7 | 127.4 | 169.6 |
| Inventories, % | 0 | 0 | 0 | 0 | 2.29 | 0.45834 | 0.45834 | 0.45834 | 0.45834 | 0.45834 |
| Accounts Payable | 54.0 | 259.0 | 413.0 | 258.0 | 323.0 | 440.6 | 586.4 | 780.5 | 1,038.9 | 1,382.8 |
| Accounts Payable, % | 2.66 | 3.96 | 5.33 | 3.08 | 3.65 | 3.74 | 3.74 | 3.74 | 3.74 | 3.74 |
| Capital Expenditure | -19.0 | -90.0 | -193.0 | -1,084.0 | -1,008.0 | -686.7 | -914.1 | -1,216.6 | -1,619.4 | -2,155.5 |
| Capital Expenditure, % | -0.93596 | -1.38 | -2.49 | -12.94 | -11.38 | -5.82 | -5.82 | -5.82 | -5.82 | -5.82 |
| Tax Rate, % | 45.55 | 45.55 | 45.55 | 45.55 | 45.55 | 45.55 | 45.55 | 45.55 | 45.55 | 45.55 |
| EBITAT | 324.0 | 715.2 | 1,054.8 | 1,113.8 | 1,047.1 | 1,547.2 | 2,059.4 | 2,741.2 | 3,648.6 | 4,856.5 |
| Depreciation | ||||||||||
| Changes in Account Receivables | ||||||||||
| Changes in Inventories | ||||||||||
| Changes in Accounts Payable | ||||||||||
| Capital Expenditure | ||||||||||
| UFCF | 283.0 | 2,001.2 | 2,585.8 | 1,343.8 | 2,689.1 | 3,134.1 | 4,258.2 | 5,667.9 | 7,544.2 | 10,041.6 |
| WACC, % | 5.29 | 5.24 | 5.32 | 5.32 | 5.26 | 5.29 | 5.29 | 5.29 | 5.29 | 5.29 |
| PV UFCF | ||||||||||
| SUM PV UFCF | 25,575.4 | |||||||||
| Long Term Growth Rate, % | 2.00 | |||||||||
| Free cash flow (T + 1) | 10,242 | |||||||||
| Terminal Value | 311,698 | |||||||||
| Present Terminal Value | 240,924 | |||||||||
| Enterprise Value | 266,500 | |||||||||
| Net Debt | 7,832 | |||||||||
| Equity Value | 258,668 | |||||||||
| Diluted Shares Outstanding, MM | 535 | |||||||||
| Equity Value Per Share | 48,349.13 |
What You Will Receive
- Accurate LSEGL Financials: Access to historical and projected data for precise valuation.
- Customizable Inputs: Adjust WACC, tax rates, revenue growth, and capital expenditures as needed.
- Real-Time Calculations: Dynamic calculation of intrinsic value and NPV.
- Scenario Testing: Explore various scenarios to assess the future performance of London Stock Exchange Group plc.
- User-Friendly Design: Designed for finance professionals while remaining approachable for novices.
Key Features
- 🔍 Real-Life LSEGL Financials: Pre-filled historical and projected data for London Stock Exchange Group plc (LSEGL).
- ✏️ Fully Customizable Inputs: Adjust all critical parameters (yellow cells) such as WACC, growth %, and tax rates.
- 📊 Professional DCF Valuation: Built-in formulas compute LSEGL's intrinsic value using the Discounted Cash Flow method.
- ⚡ Instant Results: Visualize LSEGL's valuation immediately after making adjustments.
- Scenario Analysis: Examine and compare outcomes for different financial assumptions side-by-side.
How It Works
- 1. Access the Template: Download and open the Excel file containing preloaded data from London Stock Exchange Group plc (LSEGL).
- 2. Adjust Key Inputs: Modify essential assumptions such as growth rates, WACC, and capital expenditures.
- 3. Instantly View Results: The DCF model automatically computes intrinsic value and NPV based on your inputs.
- 4. Explore Different Scenarios: Analyze various forecasts to evaluate diverse valuation results.
- 5. Present with Confidence: Share professional valuation insights to back your decision-making process.
Why Opt for This Calculator?
- User-Friendly Interface: Tailored for newcomers and seasoned professionals.
- Customizable Inputs: Easily adjust parameters to suit your analysis needs.
- Real-Time Updates: Observe immediate changes to the valuation of London Stock Exchange Group plc (LSEGL) as you modify inputs.
- Preloaded Data: Comes equipped with actual financial metrics for London Stock Exchange Group plc (LSEGL) for swift evaluations.
- Preferred by Experts: Utilized by investors and analysts for making well-informed choices.
Who Should Utilize This Product?
- Institutional Investors: Develop comprehensive and trustworthy valuation models for portfolio assessment.
- Corporate Finance Departments: Evaluate valuation scenarios to inform strategic decisions.
- Consultants and Financial Advisors: Deliver precise valuation insights for London Stock Exchange Group plc (LSEGL) to clients.
- Students and Educators: Incorporate real-world financial data for modeling practice and education.
- Market Enthusiasts: Gain insights into how firms like London Stock Exchange Group plc (LSEGL) are valued in the financial landscape.
Contents of the Template
- Historical Data: Contains LSEGL's previous financial performance and baseline forecasts.
- DCF and Levered DCF Models: Comprehensive templates designed to calculate the intrinsic value of LSEGL.
- WACC Sheet: Pre-loaded calculations for the Weighted Average Cost of Capital.
- Editable Inputs: Adjust essential parameters such as growth rates, EBITDA percentages, and CAPEX assumptions.
- Quarterly and Annual Statements: A thorough analysis of LSEGL's financial documents.
- Interactive Dashboard: Dynamically visualize valuation outcomes and forecasts.
Disclaimer
All information, articles, and product details provided on this website are for general informational and educational purposes only. We do not claim any ownership over, nor do we intend to infringe upon, any trademarks, copyrights, logos, brand names, or other intellectual property mentioned or depicted on this site. Such intellectual property remains the property of its respective owners, and any references here are made solely for identification or informational purposes, without implying any affiliation, endorsement, or partnership.
We make no representations or warranties, express or implied, regarding the accuracy, completeness, or suitability of any content or products presented. Nothing on this website should be construed as legal, tax, investment, financial, medical, or other professional advice. In addition, no part of this site—including articles or product references—constitutes a solicitation, recommendation, endorsement, advertisement, or offer to buy or sell any securities, franchises, or other financial instruments, particularly in jurisdictions where such activity would be unlawful.
All content is of a general nature and may not address the specific circumstances of any individual or entity. It is not a substitute for professional advice or services. Any actions you take based on the information provided here are strictly at your own risk. You accept full responsibility for any decisions or outcomes arising from your use of this website and agree to release us from any liability in connection with your use of, or reliance upon, the content or products found herein.