
|
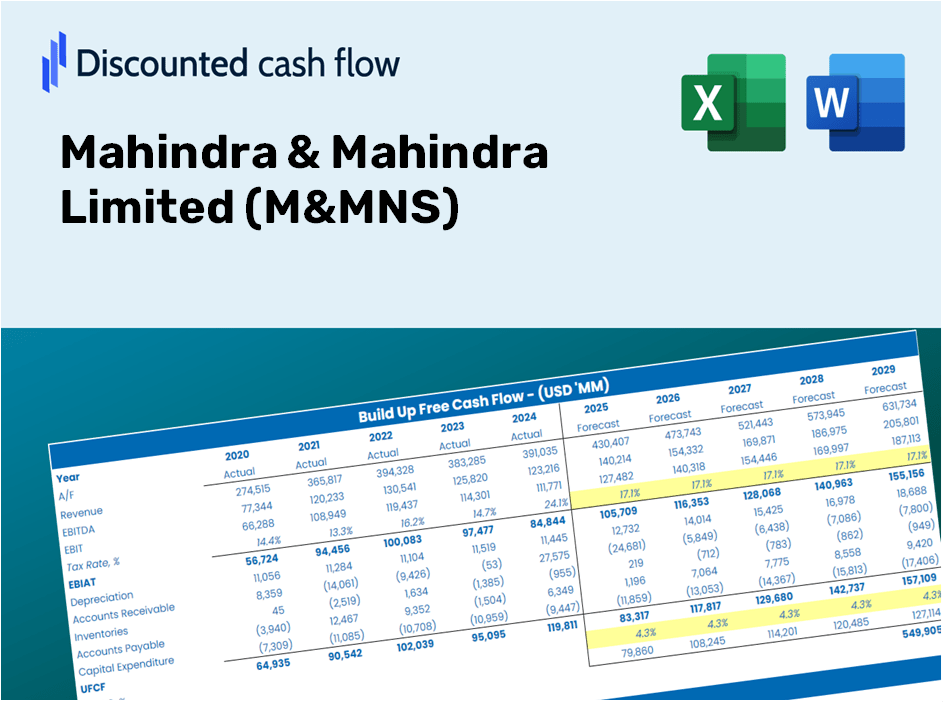
Mahindra & Mahindra Limited (M & M.NS) DCF -Bewertung |
Fully Editable: Tailor To Your Needs In Excel Or Sheets
Professional Design: Trusted, Industry-Standard Templates
Investor-Approved Valuation Models
MAC/PC Compatible, Fully Unlocked
No Expertise Is Needed; Easy To Follow
Mahindra & Mahindra Financial Services Limited (M&M.NS) Bundle
Gewinnen Sie Einblicke in Ihre Mahindra & Mahindra Limited (M & MNS) Bewertungsanalyse mit unserem ausgefeilten DCF -Taschenrechner! Diese Excel -Vorlage mit realen (M & MNS-) Daten ermöglicht es Ihnen, Vorhersagen und Annahmen für die genaue Berechnung des intrinsischen Wertes von Mahindra anzupassen & Mahindra Limited.
Benefits of Using Our Model
- Adjustable Forecast Parameters: Seamlessly modify key assumptions (growth %, margins, WACC) to explore various scenarios.
- Industry-Specific Data: Mahindra & Mahindra Limited’s (M&MNS) financial information pre-loaded to facilitate your analysis.
- Instant DCF Calculations: The template automatically computes Net Present Value (NPV) and intrinsic value for your convenience.
- Professional and Customizable: A refined Excel model designed to meet your valuation requirements.
- Tailored for Analysts and Investors: Perfect for evaluating forecasts, affirming strategies, and enhancing efficiency.
Key Features
- Comprehensive Historical Data: M&MNS’s past financial statements along with pre-established forecasts.
- Customizable Inputs: Modify WACC, tax rates, revenue growth, and EBITDA margins as needed.
- Real-Time Insights: Instantly observe the recalibration of M&MNS’s intrinsic value.
- Visual Data Representation: Dashboard graphs illustrate valuation outcomes and essential metrics.
- Designed for Precision: A professional-grade tool tailored for analysts, investors, and finance professionals.
How It Operates
- Step 1: Download the prebuilt Excel template featuring Mahindra & Mahindra Limited's (M&MNS) data.
- Step 2: Navigate through the pre-filled sheets to grasp the essential metrics.
- Step 3: Modify forecasts and assumptions in the editable yellow cells (WACC, growth, margins).
- Step 4: Quickly view updated results, including the intrinsic value of Mahindra & Mahindra Limited (M&MNS).
- Step 5: Use the insights generated to make informed investment choices or create reports.
Why Opt for This Calculator?
- User-Friendly Interface: Tailored for both novices and seasoned professionals.
- Customizable Inputs: Adjust parameters easily to suit your financial analysis.
- Real-Time Feedback: Witness immediate updates to Mahindra & Mahindra Limited’s (M&MNS) valuation as you change inputs.
- Preloaded Data: Comes equipped with Mahindra & Mahindra Limited's (M&MNS) actual financial figures for swift evaluations.
- Relied Upon by Experts: Utilized by investors and analysts for making strategic decisions.
Who Can Benefit from This Product?
- Individual Investors: Make well-informed choices regarding the purchase or sale of Mahindra & Mahindra Limited (M&MNS) shares.
- Financial Analysts: Enhance valuation procedures with accessible financial models specifically for M&MNS.
- Consultants: Provide clients with accurate and timely valuation insights related to Mahindra & Mahindra Limited (M&MNS).
- Business Owners: Gain a deeper understanding of how major firms like Mahindra & Mahindra Limited (M&MNS) are assessed, influencing your own business strategies.
- Finance Students: Explore valuation techniques through the lens of real data and scenarios involving Mahindra & Mahindra Limited (M&MNS).
Contents of the Template
- Pre-Filled Data: Features Mahindra & Mahindra Limited's (M&MNS) historical financials and projections.
- Discounted Cash Flow Model: An editable DCF valuation model with automatic calculations.
- Weighted Average Cost of Capital (WACC): A dedicated section for WACC calculation based on user-defined inputs.
- Key Financial Ratios: Evaluate M&MNS's profitability, efficiency, and capital structure.
- Customizable Inputs: Easily modify revenue growth, profit margins, and tax rates.
- Clear Dashboard: Visuals and tables that summarize essential valuation outcomes.
Disclaimer
All information, articles, and product details provided on this website are for general informational and educational purposes only. We do not claim any ownership over, nor do we intend to infringe upon, any trademarks, copyrights, logos, brand names, or other intellectual property mentioned or depicted on this site. Such intellectual property remains the property of its respective owners, and any references here are made solely for identification or informational purposes, without implying any affiliation, endorsement, or partnership.
We make no representations or warranties, express or implied, regarding the accuracy, completeness, or suitability of any content or products presented. Nothing on this website should be construed as legal, tax, investment, financial, medical, or other professional advice. In addition, no part of this site—including articles or product references—constitutes a solicitation, recommendation, endorsement, advertisement, or offer to buy or sell any securities, franchises, or other financial instruments, particularly in jurisdictions where such activity would be unlawful.
All content is of a general nature and may not address the specific circumstances of any individual or entity. It is not a substitute for professional advice or services. Any actions you take based on the information provided here are strictly at your own risk. You accept full responsibility for any decisions or outcomes arising from your use of this website and agree to release us from any liability in connection with your use of, or reliance upon, the content or products found herein.