
|
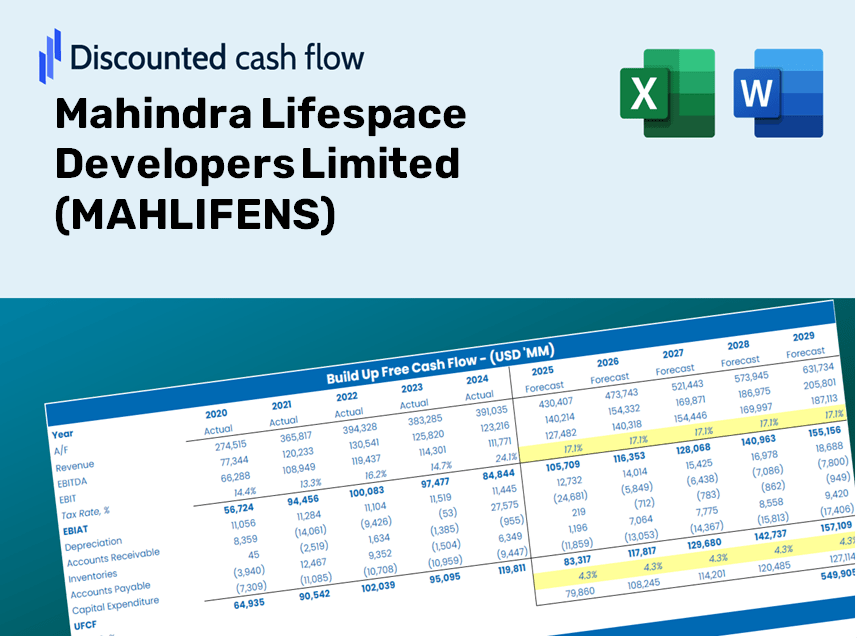
Mahindra LifeSespace Developers Limited (MahLife.NS) DCF -Bewertung |
Fully Editable: Tailor To Your Needs In Excel Or Sheets
Professional Design: Trusted, Industry-Standard Templates
Investor-Approved Valuation Models
MAC/PC Compatible, Fully Unlocked
No Expertise Is Needed; Easy To Follow
Mahindra Lifespace Developers Limited (MAHLIFE.NS) Bundle
Verbessern Sie Ihre Anlagestrategie mit dem (Mahlifens) DCF -Taschenrechner! Erforschen Sie authentische Finanzdaten für Mahindra LifeSespace Developers Limited, stellen Sie Wachstumsprojektionen und -kosten an und beobachten Sie sofort, wie sich diese Modifikationen auf den inneren Wert von (Mahlifens) auswirken.
What You Will Receive
- Accurate MAHLIFENS Financials: Features both historical and projected data for precise valuation.
- Customizable Parameters: Adjust WACC, tax rates, revenue growth, and capital expenditures as needed.
- Automatic Calculations: Intrinsic value and NPV are computed in real-time.
- Scenario Analysis: Explore various scenarios to assess Mahindra Lifespace’s future performance.
- User-Friendly Design: Designed for professionals but easily navigable for beginners.
Key Features
- Comprehensive MAHLIFENS Data: Pre-loaded with Mahindra Lifespace Developers Limited's historical financial performance and future growth estimates.
- Customizable Parameters: Modify revenue growth rates, profit margins, WACC, tax assumptions, and capital investments.
- Dynamic Valuation Framework: Automatic recalculations of Net Present Value (NPV) and intrinsic value based on your input adjustments.
- Scenario Analysis: Develop various forecasting scenarios to evaluate different valuation results.
- Intuitive Interface: Clean, organized layout designed for both seasoned professionals and newcomers.
How It Works
- 1. Access the Template: Download and open the Excel file containing Mahindra Lifespace Developers Limited’s (MAHLIFENS) preloaded data.
- 2. Customize Assumptions: Adjust critical inputs such as growth projections, WACC, and capital expenditure figures.
- 3. See Immediate Results: The DCF model automatically calculates the intrinsic value and NPV in real-time.
- 4. Explore Different Scenarios: Analyze various forecasts to understand different valuation scenarios.
- 5. Present with Assurance: Share expert valuation insights to reinforce your decision-making process.
Why Choose Mahindra Lifespace Developers Limited (MAHLIFENS)?
- Reliability: Trustworthy financial data sourced directly from Mahindra Lifespace ensures precision.
- Adaptability: Tailored for users to easily experiment with and adjust various inputs.
- Efficiency: Eliminate the need to create a financial model from the ground up.
- Expert-Level: Crafted with the insight and usability expectations of top financial executives.
- Intuitive: User-friendly interface suitable for individuals with varying levels of financial expertise.
Who Should Use This Product?
- Individual Investors: Gain insights for making informed decisions on buying or selling Mahindra Lifespace Developers Limited (MAHLIFENS) stock.
- Financial Analysts: Enhance valuation processes with efficient, ready-to-use financial models tailored for Mahindra Lifespace Developers Limited.
- Consultants: Provide clients with accurate and timely valuation insights related to Mahindra Lifespace Developers Limited.
- Business Owners: Learn about the valuation methods used for large firms like Mahindra Lifespace Developers Limited to inform your own business strategies.
- Finance Students: Explore valuation techniques using real-world data and scenarios focused on Mahindra Lifespace Developers Limited (MAHLIFENS).
Contents of the Template
- Pre-Filled Data: Contains Mahindra Lifespace Developers Limited’s historical financial performance and projections.
- Discounted Cash Flow Model: An editable DCF valuation model featuring automatic calculations.
- Weighted Average Cost of Capital (WACC): A separate sheet designed for WACC calculations using user-defined inputs.
- Key Financial Ratios: Assess the profitability, efficiency, and leverage of Mahindra Lifespace Developers Limited (MAHLIFENS).
- Customizable Inputs: Easily adjust revenue growth rates, margins, and tax rates.
- Clear Dashboard: Visual presentations such as charts and tables summarizing critical valuation outcomes.
Disclaimer
All information, articles, and product details provided on this website are for general informational and educational purposes only. We do not claim any ownership over, nor do we intend to infringe upon, any trademarks, copyrights, logos, brand names, or other intellectual property mentioned or depicted on this site. Such intellectual property remains the property of its respective owners, and any references here are made solely for identification or informational purposes, without implying any affiliation, endorsement, or partnership.
We make no representations or warranties, express or implied, regarding the accuracy, completeness, or suitability of any content or products presented. Nothing on this website should be construed as legal, tax, investment, financial, medical, or other professional advice. In addition, no part of this site—including articles or product references—constitutes a solicitation, recommendation, endorsement, advertisement, or offer to buy or sell any securities, franchises, or other financial instruments, particularly in jurisdictions where such activity would be unlawful.
All content is of a general nature and may not address the specific circumstances of any individual or entity. It is not a substitute for professional advice or services. Any actions you take based on the information provided here are strictly at your own risk. You accept full responsibility for any decisions or outcomes arising from your use of this website and agree to release us from any liability in connection with your use of, or reliance upon, the content or products found herein.