
|
Bemerkung Holdings, Inc. (Mark) DCF -Bewertung |
Fully Editable: Tailor To Your Needs In Excel Or Sheets
Professional Design: Trusted, Industry-Standard Templates
Investor-Approved Valuation Models
MAC/PC Compatible, Fully Unlocked
No Expertise Is Needed; Easy To Follow
Remark Holdings, Inc. (MARK) Bundle
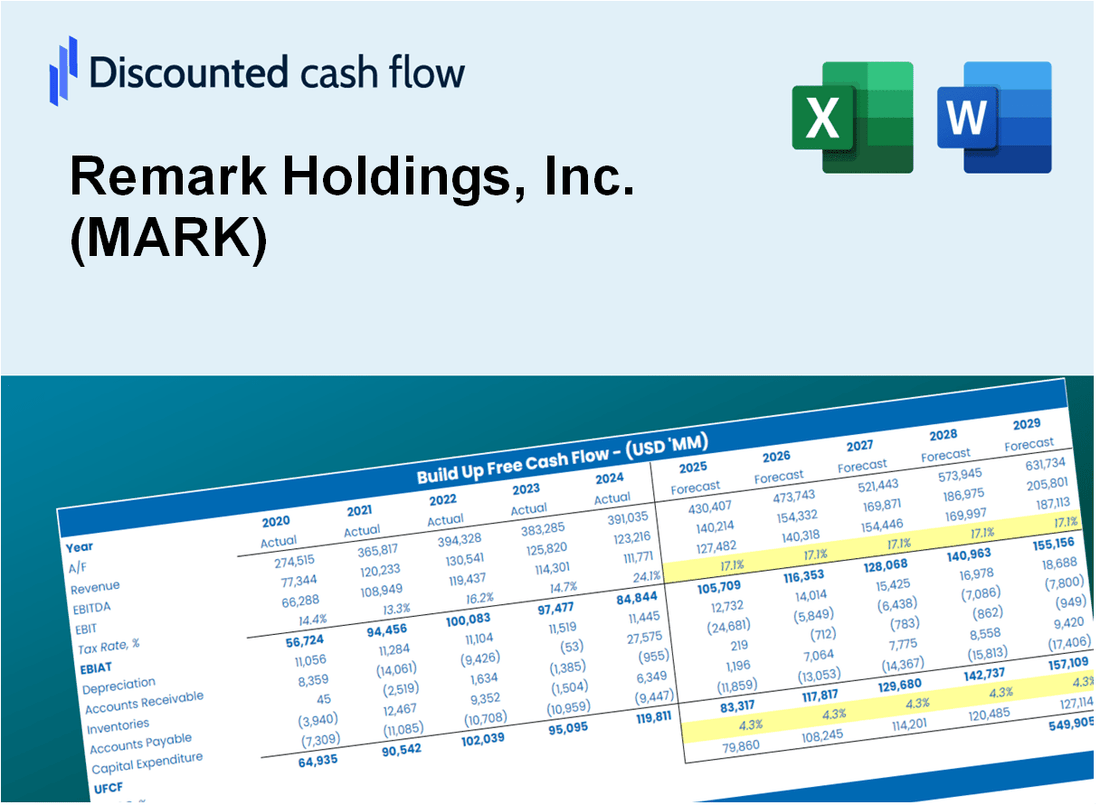
Vereinfachen Sie die Bewertung von Remark Holdings, Inc. (Mark) mit diesem anpassbaren DCF -Taschenrechner! Mit Real Bemerkung Holdings, Inc. (Mark) Finanzdaten und einstellbaren Prognoseeingaben können Sie Szenarien testen und Bemerkung Holdings, Inc. (Mark) in Minuten aufdecken.
What You Will Get
- Real MARK Financials: Access to historical and projected data for precise valuation.
- Customizable Inputs: Adjust WACC, tax rates, revenue growth, and capital expenditures as needed.
- Dynamic Calculations: Intrinsic value and NPV are computed in real-time.
- Scenario Analysis: Evaluate various scenarios to assess Remark Holdings' future performance.
- User-Friendly Design: Designed for professionals but easy for newcomers to navigate.
Key Features
- 🔍 Real-Life MARK Financials: Pre-filled historical and projected data for Remark Holdings, Inc. (MARK).
- ✏️ Fully Customizable Inputs: Adjust all critical parameters (yellow cells) such as WACC, growth %, and tax rates.
- 📊 Professional DCF Valuation: Built-in formulas calculate Remark's intrinsic value using the Discounted Cash Flow method.
- ⚡ Instant Results: Visualize Remark's valuation instantly after making adjustments.
- Scenario Analysis: Test and compare outcomes for various financial assumptions side-by-side.
How It Works
- Step 1: Download the prebuilt Excel template featuring Remark Holdings, Inc.'s (MARK) data.
- Step 2: Review the pre-filled sheets to familiarize yourself with the essential metrics.
- Step 3: Modify forecasts and assumptions in the editable yellow cells (WACC, growth, margins).
- Step 4: Instantly see the updated results, including Remark Holdings, Inc.'s (MARK) intrinsic value.
- Step 5: Use the outputs to make informed investment choices or create reports.
Why Choose This Calculator for Remark Holdings, Inc. (MARK)?
- Designed for Experts: A sophisticated tool tailored for analysts, CFOs, and financial consultants.
- Accurate Data: Remark Holdings’ historical and projected financials are preloaded for precision.
- Flexible Scenario Analysis: Effortlessly simulate various forecasts and assumptions.
- Comprehensive Outputs: Automatically computes intrinsic value, NPV, and essential metrics.
- User-Friendly: Step-by-step guidance simplifies the entire process.
Who Should Use This Product?
- Individual Investors: Make informed decisions about buying or selling Remark Holdings, Inc. (MARK) stock.
- Financial Analysts: Streamline valuation processes with ready-to-use financial models for Remark Holdings, Inc. (MARK).
- Consultants: Deliver professional valuation insights on Remark Holdings, Inc. (MARK) to clients quickly and accurately.
- Business Owners: Understand how companies like Remark Holdings, Inc. (MARK) are valued to guide your own strategy.
- Finance Students: Learn valuation techniques using real-world data and scenarios involving Remark Holdings, Inc. (MARK).
What the Template Contains
- Historical Data: Includes Remark Holdings, Inc.'s (MARK) past financials and baseline forecasts.
- DCF and Levered DCF Models: Detailed templates to calculate Remark Holdings, Inc.'s (MARK) intrinsic value.
- WACC Sheet: Pre-built calculations for Weighted Average Cost of Capital.
- Editable Inputs: Modify key drivers like growth rates, EBITDA %, and CAPEX assumptions.
- Quarterly and Annual Statements: A complete breakdown of Remark Holdings, Inc.'s (MARK) financials.
- Interactive Dashboard: Visualize valuation results and projections dynamically.
Disclaimer
All information, articles, and product details provided on this website are for general informational and educational purposes only. We do not claim any ownership over, nor do we intend to infringe upon, any trademarks, copyrights, logos, brand names, or other intellectual property mentioned or depicted on this site. Such intellectual property remains the property of its respective owners, and any references here are made solely for identification or informational purposes, without implying any affiliation, endorsement, or partnership.
We make no representations or warranties, express or implied, regarding the accuracy, completeness, or suitability of any content or products presented. Nothing on this website should be construed as legal, tax, investment, financial, medical, or other professional advice. In addition, no part of this site—including articles or product references—constitutes a solicitation, recommendation, endorsement, advertisement, or offer to buy or sell any securities, franchises, or other financial instruments, particularly in jurisdictions where such activity would be unlawful.
All content is of a general nature and may not address the specific circumstances of any individual or entity. It is not a substitute for professional advice or services. Any actions you take based on the information provided here are strictly at your own risk. You accept full responsibility for any decisions or outcomes arising from your use of this website and agree to release us from any liability in connection with your use of, or reliance upon, the content or products found herein.