
|
Mobilee Global Inc. (Mbly) DCF -Bewertung |
Fully Editable: Tailor To Your Needs In Excel Or Sheets
Professional Design: Trusted, Industry-Standard Templates
Investor-Approved Valuation Models
MAC/PC Compatible, Fully Unlocked
No Expertise Is Needed; Easy To Follow
Mobileye Global Inc. (MBLY) Bundle
Entdecken Sie Mobilee Global Inc. (Mbly) Finanzaussichten mit unserem benutzerfreundlichen DCF-Taschenrechner! Geben Sie Ihre Prognosen für Wachstum, Margen und Ausgaben ein, um den intrinsischen Wert von Mobilee Global Inc. (Mbly) zu bestimmen und Ihre Anlagestrategie zu verbessern.
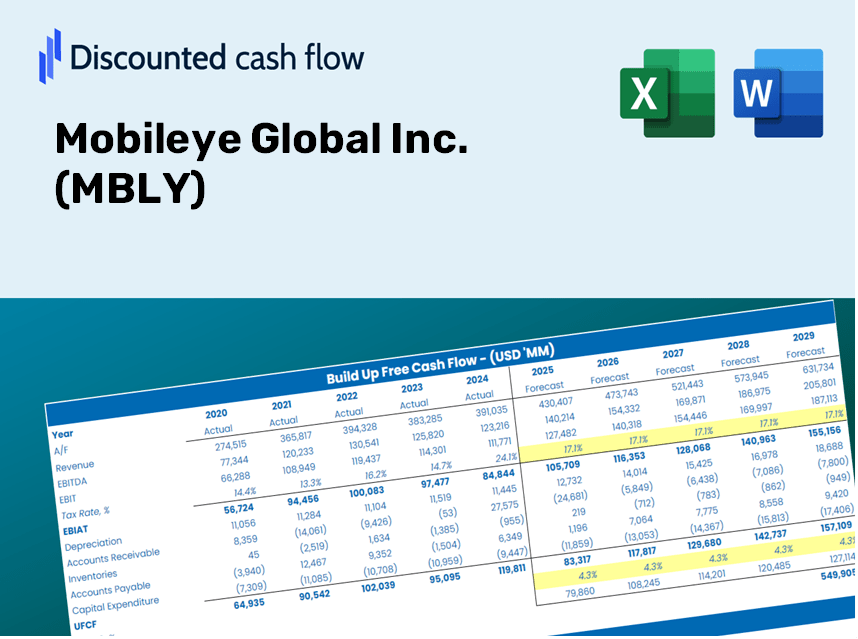
Discounted Cash Flow (DCF) - (USD MM)
| Year | AY1 2020 |
AY2 2021 |
AY3 2022 |
AY4 2023 |
AY5 2024 |
FY1 2025 |
FY2 2026 |
FY3 2027 |
FY4 2028 |
FY5 2029 |
|---|---|---|---|---|---|---|---|---|---|---|
| Revenue | 967.0 | 1,386.0 | 1,869.0 | 2,079.0 | 1,654.0 | 1,939.2 | 2,273.6 | 2,665.6 | 3,125.2 | 3,664.1 |
| Revenue Growth, % | 0 | 43.33 | 34.85 | 11.24 | -20.44 | 17.24 | 17.24 | 17.24 | 17.24 | 17.24 |
| EBITDA | -118.0 | 469.0 | 559.0 | 529.0 | -2,657.0 | -89.2 | -104.6 | -122.7 | -143.8 | -168.6 |
| EBITDA, % | -12.2 | 33.84 | 29.91 | 25.44 | -160.64 | -4.6 | -4.6 | -4.6 | -4.6 | -4.6 |
| Depreciation | 95.0 | 526.0 | 567.0 | 513.0 | 506.0 | 517.3 | 606.5 | 711.1 | 833.7 | 977.4 |
| Depreciation, % | 9.82 | 37.95 | 30.34 | 24.68 | 30.59 | 26.68 | 26.68 | 26.68 | 26.68 | 26.68 |
| EBIT | -213.0 | -57.0 | -8.0 | 16.0 | -3,163.0 | -487.9 | -572.0 | -670.7 | -786.3 | -921.9 |
| EBIT, % | -22.03 | -4.11 | -0.42804 | 0.7696 | -191.23 | -25.16 | -25.16 | -25.16 | -25.16 | -25.16 |
| Total Cash | 85.0 | 616.0 | 1,024.0 | 1,212.0 | 1,426.0 | 979.4 | 1,148.3 | 1,346.3 | 1,578.5 | 1,850.6 |
| Total Cash, percent | .0 | .0 | .0 | .0 | .0 | .0 | .0 | .0 | .0 | .0 |
| Account Receivables | 93.0 | 1,481.0 | 269.0 | 357.0 | 212.0 | 597.3 | 700.3 | 821.0 | 962.6 | 1,128.5 |
| Account Receivables, % | 9.62 | 106.85 | 14.39 | 17.17 | 12.82 | 30.8 | 30.8 | 30.8 | 30.8 | 30.8 |
| Inventories | 128.0 | 97.0 | 113.0 | 391.0 | 415.0 | 272.2 | 319.1 | 374.1 | 438.7 | 514.3 |
| Inventories, % | 13.24 | 7 | 6.05 | 18.81 | 25.09 | 14.04 | 14.04 | 14.04 | 14.04 | 14.04 |
| Accounts Payable | 109.0 | 160.0 | 189.0 | 229.0 | 190.0 | 215.0 | 252.1 | 295.5 | 346.5 | 406.2 |
| Accounts Payable, % | 11.27 | 11.54 | 10.11 | 11.01 | 11.49 | 11.09 | 11.09 | 11.09 | 11.09 | 11.09 |
| Capital Expenditure | -91.0 | -143.0 | -111.0 | -98.0 | -81.0 | -136.8 | -160.4 | -188.1 | -220.5 | -258.5 |
| Capital Expenditure, % | -9.41 | -10.32 | -5.94 | -4.71 | -4.9 | -7.06 | -7.06 | -7.06 | -7.06 | -7.06 |
| Tax Rate, % | 2.31 | 2.31 | 2.31 | 2.31 | 2.31 | 2.31 | 2.31 | 2.31 | 2.31 | 2.31 |
| EBITAT | -196.9 | -75.0 | -20.5 | -27.0 | -3,090.0 | -380.7 | -446.3 | -523.3 | -613.5 | -719.3 |
| Depreciation | ||||||||||
| Changes in Account Receivables | ||||||||||
| Changes in Inventories | ||||||||||
| Changes in Accounts Payable | ||||||||||
| Capital Expenditure | ||||||||||
| UFCF | -304.9 | -998.0 | 1,660.5 | 62.0 | -2,583.0 | -217.7 | -113.1 | -132.6 | -155.5 | -182.3 |
| WACC, % | 6.09 | 6.09 | 6.09 | 6.07 | 6.09 | 6.08 | 6.08 | 6.08 | 6.08 | 6.08 |
| PV UFCF | ||||||||||
| SUM PV UFCF | -675.2 | |||||||||
| Long Term Growth Rate, % | 4.00 | |||||||||
| Free cash flow (T + 1) | -190 | |||||||||
| Terminal Value | -9,100 | |||||||||
| Present Terminal Value | -6,773 | |||||||||
| Enterprise Value | -7,448 | |||||||||
| Net Debt | -1,376 | |||||||||
| Equity Value | -6,072 | |||||||||
| Diluted Shares Outstanding, MM | 809 | |||||||||
| Equity Value Per Share | -7.51 |
Benefits You Will Receive
- Pre-Filled Financial Model: Mobileye’s actual data provides an accurate basis for DCF valuation.
- Comprehensive Forecast Control: Modify revenue growth, profit margins, WACC, and other essential factors.
- Real-Time Calculations: Automatic updates deliver instant results as you adjust inputs.
- Professionally Designed Template: A polished Excel file specifically crafted for high-quality valuation.
- Flexible and Reusable: Designed for easy customization, perfect for multiple detailed forecasting scenarios.
Key Features
- Pre-Loaded Data: Mobileye Global Inc.'s historical financial statements alongside pre-filled forecasts.
- Fully Adjustable Inputs: Customize inputs for WACC, tax rates, revenue growth, and EBITDA margins.
- Instant Results: Observe Mobileye's intrinsic value recalculating in real time.
- Clear Visual Outputs: Dashboard charts showcase valuation results and key metrics.
- Built for Accuracy: A professional tool designed for analysts, investors, and finance experts.
How It Operates
- Download: Obtain the pre-configured Excel file featuring Mobileye’s financial metrics.
- Customize: Tailor projections such as revenue growth, EBITDA margin, and WACC to your needs.
- Update Automatically: Benefit from real-time updates for intrinsic value and NPV calculations.
- Test Scenarios: Generate various projections and evaluate results instantly.
- Make Decisions: Leverage the valuation findings to inform your investment approach for Mobileye Global Inc. (MBLY).
Why Choose This Calculator for Mobileye Global Inc. (MBLY)?
- User-Friendly Interface: Perfectly suited for both newcomers and seasoned professionals.
- Customizable Inputs: Adjust parameters easily to tailor your analysis.
- Real-Time Feedback: Watch Mobileye’s valuation update instantly as you change the inputs.
- Preloaded Data: Comes equipped with Mobileye’s actual financial metrics for seamless analysis.
- Endorsed by Experts: Favored by investors and analysts for making well-informed choices.
Who Can Benefit from This Product?
- Finance Students: Discover valuation methodologies and apply them to real-world data.
- Academics: Utilize advanced models in your teaching or research projects.
- Investors: Challenge your assumptions and evaluate valuation results for Mobileye Global Inc. (MBLY).
- Analysts: Enhance your efficiency with a ready-to-use, customizable DCF model.
- Small Business Owners: Understand the analytical processes used for large public companies like Mobileye Global Inc. (MBLY).
Contents of the Template
- Preloaded MBLY Data: Historical and projected financial metrics, including revenue, EBIT, and capital expenditures.
- DCF and WACC Models: Professional-quality sheets to compute intrinsic value and Weighted Average Cost of Capital.
- Editable Inputs: Yellow-highlighted cells for customizing revenue growth, tax rates, and discount rates.
- Financial Statements: Detailed annual and quarterly financial reports for in-depth analysis.
- Key Ratios: Profitability, leverage, and efficiency ratios for assessing performance.
- Dashboard and Charts: Visual representations of valuation results and underlying assumptions.
Disclaimer
All information, articles, and product details provided on this website are for general informational and educational purposes only. We do not claim any ownership over, nor do we intend to infringe upon, any trademarks, copyrights, logos, brand names, or other intellectual property mentioned or depicted on this site. Such intellectual property remains the property of its respective owners, and any references here are made solely for identification or informational purposes, without implying any affiliation, endorsement, or partnership.
We make no representations or warranties, express or implied, regarding the accuracy, completeness, or suitability of any content or products presented. Nothing on this website should be construed as legal, tax, investment, financial, medical, or other professional advice. In addition, no part of this site—including articles or product references—constitutes a solicitation, recommendation, endorsement, advertisement, or offer to buy or sell any securities, franchises, or other financial instruments, particularly in jurisdictions where such activity would be unlawful.
All content is of a general nature and may not address the specific circumstances of any individual or entity. It is not a substitute for professional advice or services. Any actions you take based on the information provided here are strictly at your own risk. You accept full responsibility for any decisions or outcomes arising from your use of this website and agree to release us from any liability in connection with your use of, or reliance upon, the content or products found herein.