
|
DCF -Bewertung der Mercantile Bank Corporation (MBWM) |
Fully Editable: Tailor To Your Needs In Excel Or Sheets
Professional Design: Trusted, Industry-Standard Templates
Investor-Approved Valuation Models
MAC/PC Compatible, Fully Unlocked
No Expertise Is Needed; Easy To Follow
Mercantile Bank Corporation (MBWM) Bundle
Erhalten Sie die Bewertungsanalyse für Ihre Mercantile Bank Corporation (MBWM) mit unserem ausgeklügelten DCF -Taschenrechner! Diese Excel -Vorlage wird mit realen (MBWM-) Daten vorinstalliert, sodass Sie Prognosen und Annahmen für eine genaue Berechnung des inneren Wertes der Mercantile Bank anpassen können.
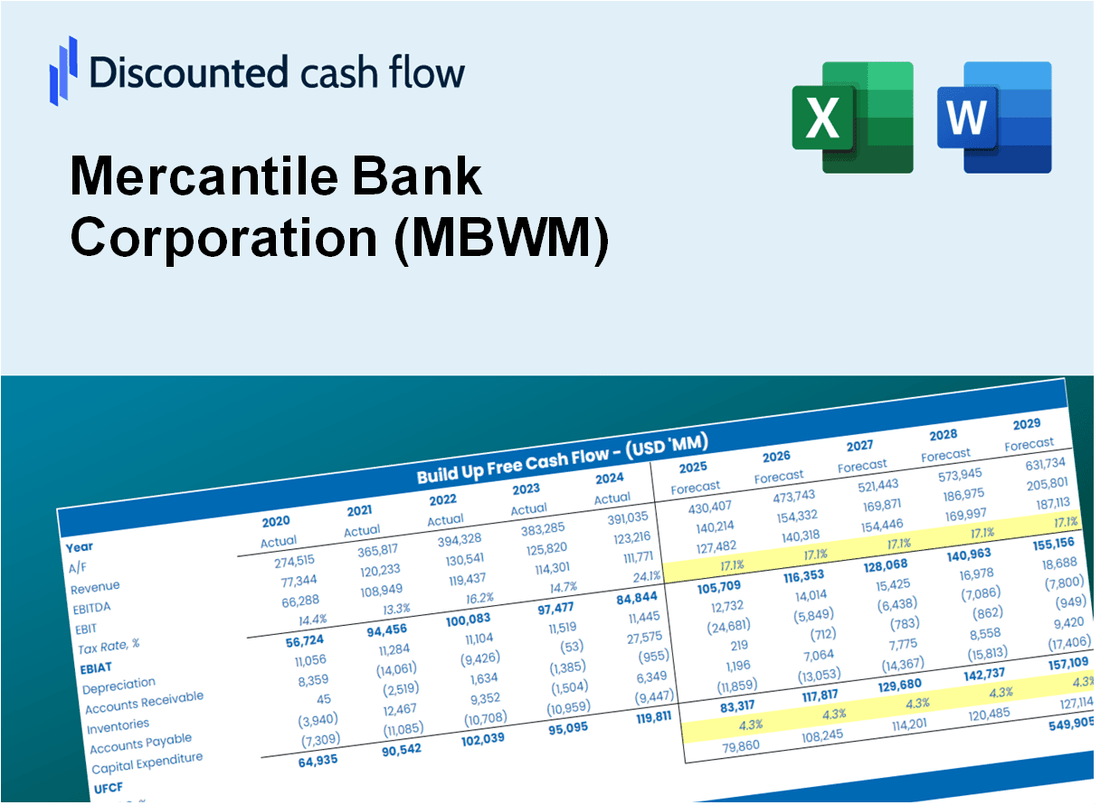
Discounted Cash Flow (DCF) - (USD MM)
| Year | AY1 2020 |
AY2 2021 |
AY3 2022 |
AY4 2023 |
AY5 2024 |
FY1 2025 |
FY2 2026 |
FY3 2027 |
FY4 2028 |
FY5 2029 |
|---|---|---|---|---|---|---|---|---|---|---|
| Revenue | 193.5 | 198.7 | 213.9 | 303.5 | 361.9 | 426.6 | 502.8 | 592.6 | 698.5 | 823.3 |
| Revenue Growth, % | 0 | 2.67 | 7.68 | 41.88 | 19.24 | 17.87 | 17.87 | 17.87 | 17.87 | 17.87 |
| EBITDA | 64.3 | 87.4 | 88.7 | 114.2 | 108.8 | 159.0 | 187.4 | 220.9 | 260.4 | 306.9 |
| EBITDA, % | 33.22 | 43.99 | 41.48 | 37.63 | 30.06 | 37.28 | 37.28 | 37.28 | 37.28 | 37.28 |
| Depreciation | 9.4 | 13.7 | 12.9 | 11.5 | 10.5 | 20.9 | 24.6 | 29.0 | 34.2 | 40.3 |
| Depreciation, % | 4.87 | 6.89 | 6.05 | 3.79 | 2.9 | 4.9 | 4.9 | 4.9 | 4.9 | 4.9 |
| EBIT | 54.8 | 73.7 | 75.8 | 102.7 | 98.3 | 138.1 | 162.8 | 191.9 | 226.1 | 266.6 |
| EBIT, % | 28.35 | 37.11 | 35.43 | 33.84 | 27.16 | 32.38 | 32.38 | 32.38 | 32.38 | 32.38 |
| Total Cash | 1,013.4 | 1,567.9 | 699.7 | 747.6 | 1,123.4 | 426.6 | 502.8 | 592.6 | 698.5 | 823.3 |
| Total Cash, percent | .0 | .0 | .0 | .0 | .0 | .0 | .0 | .0 | .0 | .0 |
| Account Receivables | .0 | .0 | .0 | .0 | .0 | .0 | .0 | .0 | .0 | .0 |
| Account Receivables, % | 0 | 0 | 0 | 0 | 0 | 0 | 0 | 0 | 0 | 0 |
| Inventories | .0 | .0 | .0 | .0 | .0 | .0 | .0 | .0 | .0 | .0 |
| Inventories, % | 0 | 0 | 0 | 0 | 0 | 0 | 0 | 0 | 0 | 0 |
| Accounts Payable | 24.3 | 24.6 | 78.2 | .0 | .0 | 52.5 | 61.9 | 72.9 | 86.0 | 101.3 |
| Accounts Payable, % | 12.56 | 12.41 | 36.56 | 0 | 0 | 12.31 | 12.31 | 12.31 | 12.31 | 12.31 |
| Capital Expenditure | -9.0 | -5.6 | -3.0 | -6.7 | -8.5 | -11.5 | -13.5 | -15.9 | -18.8 | -22.1 |
| Capital Expenditure, % | -4.65 | -2.82 | -1.41 | -2.2 | -2.36 | -2.69 | -2.69 | -2.69 | -2.69 | -2.69 |
| Tax Rate, % | 19.02 | 19.02 | 19.02 | 19.02 | 19.02 | 19.02 | 19.02 | 19.02 | 19.02 | 19.02 |
| EBITAT | 44.1 | 59.0 | 61.1 | 82.2 | 79.6 | 111.1 | 130.9 | 154.3 | 181.9 | 214.4 |
| Depreciation | ||||||||||
| Changes in Account Receivables | ||||||||||
| Changes in Inventories | ||||||||||
| Changes in Accounts Payable | ||||||||||
| Capital Expenditure | ||||||||||
| UFCF | 68.9 | 67.4 | 124.6 | 8.8 | 81.6 | 173.0 | 151.4 | 178.5 | 210.4 | 248.0 |
| WACC, % | 11.78 | 11.75 | 11.79 | 11.74 | 11.83 | 11.78 | 11.78 | 11.78 | 11.78 | 11.78 |
| PV UFCF | ||||||||||
| SUM PV UFCF | 680.6 | |||||||||
| Long Term Growth Rate, % | 2.00 | |||||||||
| Free cash flow (T + 1) | 253 | |||||||||
| Terminal Value | 2,586 | |||||||||
| Present Terminal Value | 1,482 | |||||||||
| Enterprise Value | 2,162 | |||||||||
| Net Debt | 255 | |||||||||
| Equity Value | 1,907 | |||||||||
| Diluted Shares Outstanding, MM | 16 | |||||||||
| Equity Value Per Share | 118.23 |
What You Will Receive
- Customizable Excel Template: A fully adjustable Excel-based DCF Calculator featuring pre-filled real MBWM financials.
- Real-World Insights: Historical data and forward-looking projections (as indicated in the highlighted cells).
- Flexible Forecasting: Modify forecast assumptions such as revenue growth, EBITDA %, and WACC.
- Instant Calculations: Immediately observe the effect of your inputs on Mercantile Bank's valuation.
- Professional Resource: Designed for investors, CFOs, consultants, and financial analysts.
- Intuitive Layout: Organized for clarity and ease of navigation, complete with step-by-step guidance.
Key Features
- Real-Time MBWM Data: Pre-loaded with Mercantile Bank Corporation's historical financials and future projections.
- Customizable Assumptions: Modify growth rates, profit margins, cost of capital, tax rates, and capital expenditures.
- Dynamic Valuation Framework: Automatically recalculates Net Present Value (NPV) and intrinsic value based on your adjustments.
- Scenario Analysis: Develop various forecasting scenarios to explore different valuation possibilities.
- Intuitive Interface: Designed to be straightforward and accessible for both experienced professionals and newcomers.
How It Works
- Download: Get the pre-built Excel file containing Mercantile Bank Corporation’s (MBWM) financial data.
- Customize: Tailor your forecasts, including revenue growth, EBITDA %, and WACC to fit your analysis.
- Update Automatically: Watch as the intrinsic value and NPV calculations refresh in real-time.
- Test Scenarios: Generate multiple projections and evaluate different outcomes instantly.
- Make Decisions: Leverage the valuation insights to inform your investment strategy.
Why Choose Mercantile Bank Corporation (MBWM)?
- Save Time: Quickly access banking solutions without the hassle of lengthy processes.
- Enhance Security: Advanced security measures protect your financial information effectively.
- Fully Customizable Services: Tailor banking products to meet your unique financial needs.
- User-Friendly Experience: Intuitive interfaces and support make banking straightforward.
- Trusted by Clients: A reliable partner for individuals and businesses seeking financial growth.
Who Should Use Mercantile Bank Corporation (MBWM)?
- Investors: Make informed investment choices with insights from a reputable financial institution.
- Financial Analysts: Access comprehensive reports and data to streamline your analysis process.
- Consultants: Utilize reliable banking solutions to enhance client strategies and recommendations.
- Finance Enthusiasts: Explore various banking services to broaden your financial knowledge and expertise.
- Educators and Students: Leverage real-world banking scenarios for practical applications in finance education.
What the Template Contains
- Comprehensive DCF Model: Editable template featuring detailed valuation calculations tailored for Mercantile Bank Corporation (MBWM).
- Real-World Data: Mercantile Bank's historical and projected financials preloaded for in-depth analysis.
- Customizable Parameters: Modify WACC, growth rates, and tax assumptions to explore different scenarios.
- Financial Statements: Complete annual and quarterly breakdowns for enhanced insights.
- Key Ratios: Integrated analysis for profitability, efficiency, and leverage metrics.
- Dashboard with Visual Outputs: Charts and tables designed for clear, actionable insights.
Disclaimer
All information, articles, and product details provided on this website are for general informational and educational purposes only. We do not claim any ownership over, nor do we intend to infringe upon, any trademarks, copyrights, logos, brand names, or other intellectual property mentioned or depicted on this site. Such intellectual property remains the property of its respective owners, and any references here are made solely for identification or informational purposes, without implying any affiliation, endorsement, or partnership.
We make no representations or warranties, express or implied, regarding the accuracy, completeness, or suitability of any content or products presented. Nothing on this website should be construed as legal, tax, investment, financial, medical, or other professional advice. In addition, no part of this site—including articles or product references—constitutes a solicitation, recommendation, endorsement, advertisement, or offer to buy or sell any securities, franchises, or other financial instruments, particularly in jurisdictions where such activity would be unlawful.
All content is of a general nature and may not address the specific circumstances of any individual or entity. It is not a substitute for professional advice or services. Any actions you take based on the information provided here are strictly at your own risk. You accept full responsibility for any decisions or outcomes arising from your use of this website and agree to release us from any liability in connection with your use of, or reliance upon, the content or products found herein.