
|
Global Health Limited (Medanta.NS) DCF -Bewertung |
Fully Editable: Tailor To Your Needs In Excel Or Sheets
Professional Design: Trusted, Industry-Standard Templates
Investor-Approved Valuation Models
MAC/PC Compatible, Fully Unlocked
No Expertise Is Needed; Easy To Follow
Global Health Limited (MEDANTA.NS) Bundle
Entdecken Sie das wahre Potenzial von Global Health Limited mit unserem DCF-Taschenrechner für professionelle Qualität! Passen Sie die wichtigsten Annahmen an, erkunden Sie verschiedene Szenarien und bewerten Sie, wie Veränderungen die Bewertung von Global Health Limited beeinflussen - alles innerhalb einer Excel -Vorlage.
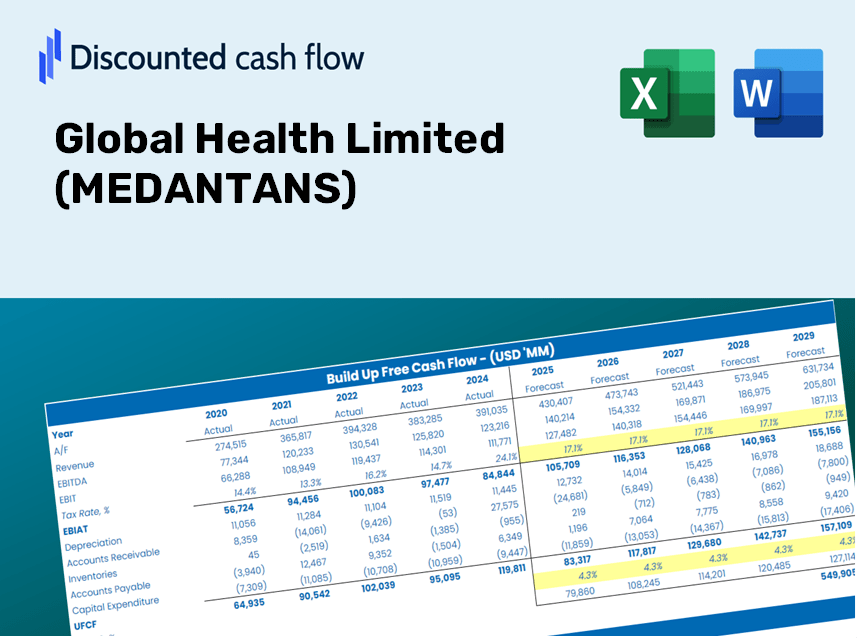
Discounted Cash Flow (DCF) - (USD MM)
| Year | AY1 2021 |
AY2 2022 |
AY3 2023 |
AY4 2024 |
AY5 2025 |
FY1 2026 |
FY2 2027 |
FY3 2028 |
FY4 2029 |
FY5 2030 |
|---|---|---|---|---|---|---|---|---|---|---|
| Revenue | 14,293.2 | 21,673.0 | 26,942.5 | 32,751.1 | 36,923.2 | 47,099.4 | 60,080.3 | 76,638.9 | 97,761.0 | 124,704.6 |
| Revenue Growth, % | 0 | 51.63 | 24.31 | 21.56 | 12.74 | 27.56 | 27.56 | 27.56 | 27.56 | 27.56 |
| EBITDA | 2,283.2 | 4,897.6 | 6,780.9 | 8,718.2 | 8,770.6 | 10,749.3 | 13,711.9 | 17,491.0 | 22,311.6 | 28,460.8 |
| EBITDA, % | 15.97 | 22.6 | 25.17 | 26.62 | 23.75 | 22.82 | 22.82 | 22.82 | 22.82 | 22.82 |
| Depreciation | 1,232.1 | 1,297.1 | 1,499.2 | 1,727.3 | 1,937.5 | 2,891.1 | 3,687.9 | 4,704.2 | 6,000.8 | 7,654.6 |
| Depreciation, % | 8.62 | 5.99 | 5.56 | 5.27 | 5.25 | 6.14 | 6.14 | 6.14 | 6.14 | 6.14 |
| EBIT | 1,051.1 | 3,600.4 | 5,281.8 | 6,990.9 | 6,833.2 | 7,858.2 | 10,024.0 | 12,786.7 | 16,310.8 | 20,806.2 |
| EBIT, % | 7.35 | 16.61 | 19.6 | 21.35 | 18.51 | 16.68 | 16.68 | 16.68 | 16.68 | 16.68 |
| Total Cash | 2,893.0 | 5,118.1 | 12,603.9 | 11,561.3 | 10,507.2 | 14,543.7 | 18,552.0 | 23,665.1 | 30,187.4 | 38,507.2 |
| Total Cash, percent | .0 | .0 | .0 | .0 | .0 | .0 | .0 | .0 | .0 | .0 |
| Account Receivables | 1,655.0 | 2,209.0 | 2,234.1 | 2,361.2 | 2,918.6 | 4,255.7 | 5,428.5 | 6,924.7 | 8,833.2 | 11,267.7 |
| Account Receivables, % | 11.58 | 10.19 | 8.29 | 7.21 | 7.9 | 9.04 | 9.04 | 9.04 | 9.04 | 9.04 |
| Inventories | 397.6 | 555.2 | 603.7 | 668.5 | 671.4 | 1,078.0 | 1,375.1 | 1,754.1 | 2,237.5 | 2,854.2 |
| Inventories, % | 2.78 | 2.56 | 2.24 | 2.04 | 1.82 | 2.29 | 2.29 | 2.29 | 2.29 | 2.29 |
| Accounts Payable | 1,315.5 | 1,343.3 | 602.2 | 1,867.8 | 1,948.1 | 2,695.6 | 3,438.5 | 4,386.2 | 5,595.1 | 7,137.1 |
| Accounts Payable, % | 9.2 | 6.2 | 2.24 | 5.7 | 5.28 | 5.72 | 5.72 | 5.72 | 5.72 | 5.72 |
| Capital Expenditure | -1,457.4 | -2,744.7 | -2,359.9 | -2,785.9 | -5,165.5 | -5,097.6 | -6,502.6 | -8,294.7 | -10,580.8 | -13,496.9 |
| Capital Expenditure, % | -10.2 | -12.66 | -8.76 | -8.51 | -13.99 | -10.82 | -10.82 | -10.82 | -10.82 | -10.82 |
| Tax Rate, % | 25.62 | 25.62 | 25.62 | 25.62 | 25.62 | 25.62 | 25.62 | 25.62 | 25.62 | 25.62 |
| EBITAT | 932.6 | 2,517.8 | 3,833.3 | 5,330.9 | 5,082.6 | 6,001.7 | 7,655.8 | 9,765.8 | 12,457.3 | 15,890.6 |
| Depreciation | ||||||||||
| Changes in Account Receivables | ||||||||||
| Changes in Inventories | ||||||||||
| Changes in Accounts Payable | ||||||||||
| Capital Expenditure | ||||||||||
| UFCF | -29.7 | 386.3 | 2,158.0 | 5,346.0 | 1,374.6 | 2,798.9 | 4,114.0 | 5,247.9 | 6,694.3 | 8,539.2 |
| WACC, % | 4.6 | 4.57 | 4.57 | 4.58 | 4.58 | 4.58 | 4.58 | 4.58 | 4.58 | 4.58 |
| PV UFCF | ||||||||||
| SUM PV UFCF | 23,448.6 | |||||||||
| Long Term Growth Rate, % | 4.00 | |||||||||
| Free cash flow (T + 1) | 8,881 | |||||||||
| Terminal Value | 1,531,051 | |||||||||
| Present Terminal Value | 1,223,899 | |||||||||
| Enterprise Value | 1,247,348 | |||||||||
| Net Debt | -4,046 | |||||||||
| Equity Value | 1,251,394 | |||||||||
| Diluted Shares Outstanding, MM | 269 | |||||||||
| Equity Value Per Share | 4,657.93 |
Benefits You Will Receive
- Adjustable Forecast Parameters: Effortlessly modify assumptions (growth %, margins, WACC) to develop various scenarios.
- Real-Time Market Data: MEDANTANS's financial information pre-loaded to enhance your analysis.
- Instant DCF Calculations: The template automatically computes Net Present Value (NPV) and intrinsic value for you.
- Customizable and Professional Design: A sleek Excel model tailored to meet your valuation requirements.
- Designed for Analysts and Investors: Perfect for testing forecasts, validating strategies, and optimizing efficiency.
Key Features
- Comprehensive Data: Access Global Health Limited’s (MEDANTANS) detailed financial reports and comprehensive forecasts.
- Customizable Parameters: Tailor inputs for WACC, tax rates, revenue growth, and EBITDA margins to suit your analysis.
- Real-Time Calculations: View the intrinsic value of Global Health Limited (MEDANTANS) update instantly as you adjust inputs.
- Intuitive Visualizations: Access a dashboard with charts that clearly present valuation results and vital metrics.
- Designed for Precision: A reliable tool crafted for analysts, investors, and finance professionals.
How It Functions
- Download the Template: Obtain immediate access to the Excel-based MEDANTANS DCF Calculator.
- Input Your Assumptions: Modify the yellow-highlighted cells for growth rates, WACC, profit margins, and additional factors.
- Instant Calculations: The model automatically calculates the intrinsic value of Global Health Limited (MEDANTANS).
- Test Scenarios: Experiment with various assumptions to assess potential changes in valuation.
- Analyze and Decide: Leverage the results to inform your investment or financial analysis decisions.
Reasons to Choose Our Calculator for Global Health Limited (MEDANTANS)
- Precision: Utilizes authentic Global Health financial data for reliable results.
- Adaptability: Built for users to easily test and adjust inputs as needed.
- Efficiency: Avoid the complexities of developing a DCF model from the ground up.
- Expert-Level: Crafted with the accuracy and functionality expected at the CFO level.
- Intuitive Interface: Simple to navigate, suitable for individuals without extensive financial modeling skills.
Who Can Benefit from Global Health Limited (MEDANTANS)?
- Investors: Accurately assess the fair value of Global Health Limited (MEDANTANS) prior to making investment choices.
- CFOs: Utilize a sophisticated DCF model for financial reporting and strategic analysis.
- Consultants: Efficiently customize the template for valuation reports tailored to clients' needs.
- Entrepreneurs: Learn about the financial modeling techniques employed by leading health companies.
- Educators: Implement it as a resource for teaching various valuation approaches.
Contents of the Template
- Operating and Balance Sheet Data: Pre-filled historical data and forecasts for Global Health Limited (MEDANTANS), including revenue, EBITDA, EBIT, and capital expenditures.
- WACC Calculation: A dedicated sheet for calculating the Weighted Average Cost of Capital (WACC), featuring parameters such as Beta, risk-free rate, and share price.
- DCF Valuation (Unlevered and Levered): Customizable Discounted Cash Flow models that present intrinsic value along with detailed calculations.
- Financial Statements: Pre-loaded annual and quarterly financial statements to aid in comprehensive analysis.
- Key Ratios: Includes various profitability, leverage, and efficiency ratios for Global Health Limited (MEDANTANS).
- Dashboard and Charts: A visual overview of valuation outputs and assumptions to facilitate result analysis.
Disclaimer
All information, articles, and product details provided on this website are for general informational and educational purposes only. We do not claim any ownership over, nor do we intend to infringe upon, any trademarks, copyrights, logos, brand names, or other intellectual property mentioned or depicted on this site. Such intellectual property remains the property of its respective owners, and any references here are made solely for identification or informational purposes, without implying any affiliation, endorsement, or partnership.
We make no representations or warranties, express or implied, regarding the accuracy, completeness, or suitability of any content or products presented. Nothing on this website should be construed as legal, tax, investment, financial, medical, or other professional advice. In addition, no part of this site—including articles or product references—constitutes a solicitation, recommendation, endorsement, advertisement, or offer to buy or sell any securities, franchises, or other financial instruments, particularly in jurisdictions where such activity would be unlawful.
All content is of a general nature and may not address the specific circumstances of any individual or entity. It is not a substitute for professional advice or services. Any actions you take based on the information provided here are strictly at your own risk. You accept full responsibility for any decisions or outcomes arising from your use of this website and agree to release us from any liability in connection with your use of, or reliance upon, the content or products found herein.